Probability distributions.

Probability distributions frequently used, different to the normal one, are described: Student’s t, chi-square and Snédecor’s F.
Moviegoers do not be mistaken. We are not going to talk about the 1962 year movie in which little Chencho get lost in the Plaza Mayor at Christmas and it takes until summer to find him, largely thanks to the search tenacity of his grandpa. Today we’re going to talk about another large family related to probability density functions and I hope nobody ends up as lost as the poor Chencho on the film.
Probability distributions
No doubt the queen of density functions is the normal distribution, the bell-shaped. This is a probability distribution that is characterized by its mean and standard deviation and is at the core of all the calculus of probability and statistical inference. But there’re other continuous probability distributions that look something or much to the normal distribution and that are also widely used when contrasting hypothesis.
Student’s t distribution
The first one we’re going to talk about is the Student’s t distribution. For those curious of science history I’ll say that the inventor of this statistic was actually William Sealy Gosset, but as he must have liked his name very little, he used to sign his writings under the pseudonym of Student. Hence the name of this statistic.
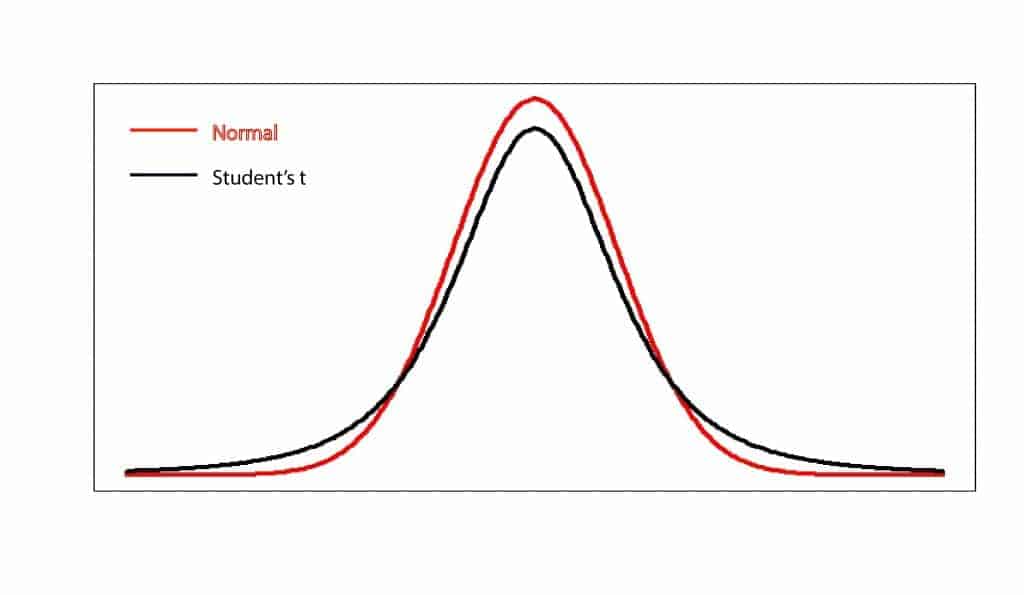
This density function is a bell-shaped one that is distributed symmetrically around its mean. It’s very similar to the normal curve, although with a heavier tails; this is the reason why this distribution estimates are less accurate when the sample is small, since more data under the tails implies always the possibility of having more results far from the mean. There are an infinite number of student’s t distributions, all of them characterized by their mean, variance and degrees of freedom, but when the sample size is greater than 30 (with increasing the degrees of freedom), t distribution can be approximate to a normal distribution, so we can use the latter without making big mistakes.
Student’s t is used to compare the means of normally distributed populations when their sample sizes are small or when the values of the populations variances are unknown. And this works so because if we subtract the mean from a sample of variables and divide the result by the standard error, the value we get follows a Student’s t distribution.
Chi-square distribution
Another member of this family of continuous distributions is that of the chi-square, which also plays an important role in statistics. If we have a sample of normally distributed variables and we squared them, their sum will follow a chi-square with a number of degrees of freedom equal to the sample size. In practice, when we have a series of values of a variable, we can subtract the expected values under the null hypothesis from the observed ones, square these differences, and add them up to check the probability of coming up with that value according to the density function of a chi-square. So, we will decide whether to reject or not our null hypothesis.
This technique can be used with three aims: determining the goodness of fit to a theoretical population, to test the homogeneity of two populations and to contrast the independence of two variables.
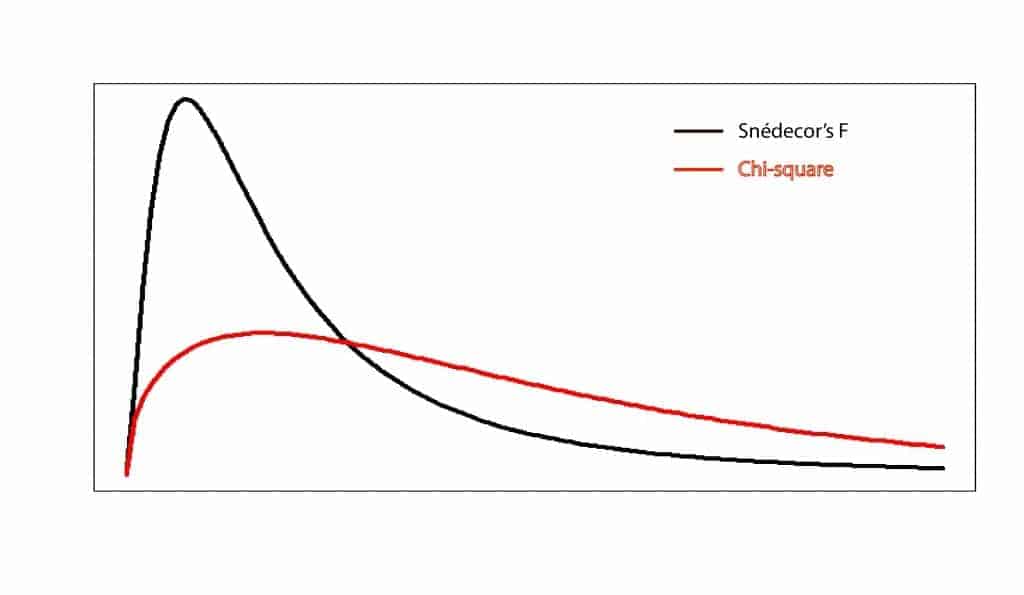
Unlike the normal distribution, chi-square’s density function only has positive values, so it is asymmetric with a long right tail. What happens is that the curve becomes gradually more symmetric as degrees of freedom increase, increasingly resembling a normal distribution.
Snédecor’s F distribution
The last distribution of which we are going to talk about is the Snedecor’s F distribution. There’s not surprise in its name about their invention, although it seems that a certain Fisher was also involved in the creation of this statistic.
This distribution is more related to the chi-square than to normal distribution, because it’s de density function of the ratio of two chi-square distributions. As is easy to understand, it only has positive values and its shape depends on the number of degrees of freedom of the two chi-square distribution that determine it. This distribution is used for the constrast of means in the analysis of variance (ANOVA).
We’re leaving…
In summary, we can see that there’re several very similar probability distributions or density function distributions to calculate probabilities and that are useful in various hypothesis contrast. But there’re many more, as the bivariate normal distribution, the negative binomial distribution, the uniform distribution, and the beta and gamma distributions, to name a few. But that’s another story…
