Berkson’s fallacy.

Berkson’s fallacy is described, which occurs when we find a spurious association between two variables due to a improper sample.
We all like to generalize and statisticians and epidemiologists more than anyone. After all, one of the main purposes of these two sciences is to apply conclusions to an inaccessible population drawn from the results get in a smaller and therefore more manageable sample.
For example, when we perform a study about the effect of a risk factor for a particular disease, we usually do it with a small number of cases, which is our sample, but to draw conclusions that we can extrapolate to the whole population. Of course, to do so, we need the sample is appropriate and representative of the population we want to generalize the results. Let’s see an example of what happens when this assumption is not met.

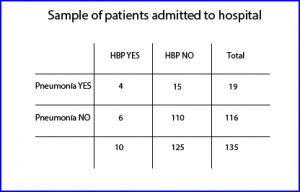
First, let’s see if there is any association between the two variables. So, we can make a chi-square’s test under the null hypothesis of no association. I used the R program to calculate it. First I built the table with the following command:
Admission <- matrix(c(4,6,15,110), ncol=2)
and then I calculated the chi-squared test applying the Yates correction (there is a cell with lower than five instances):
chisq.test(Admission, correct=T)
and I get a value of chi = 3.91, that for one degree of freedom corresponds to a value of p = 0.04. As it is less than 0.05, I reject the null hypothesis of no association and concluded that there is an association between the two variables.
Now, to calculate the strength of the association I calculate the odds ratio, using any of the epidemiology calculators available on the Internet. The odds ratio is 4.89, with a 95% confidence interval from 1.24 to 19.34, so we concluded that patients with pneumonia are nearly five times more likely to have hypertension.
Berkson’s fallacy
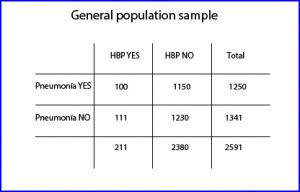
And so far everything is going well. The problem would arise if we succumb to the temptation to generalize the results to the general population. And this is because the odds ratio measures the strength of association between two variables provided that the sample was obtained randomly, which is not our case. Let’s see what happens if we repeat the experiment with a larger sample obtained, not from our hospital record, but from the general population (that includes the participants of the first experiment).

It no longer makes much sense to calculate the odds ratio, but we can do it and see that it values 0.96, with a 95% confidence interval from 0.73 to 1.21. Because the interval includes the value of one, the odds ratio is not significant.
Why does it occur this difference between the two results? This is because the risk of hospitalization is different among different groups. Of the 100 individuals who have pneumonia (second table), four require admission (first table), then the risk is 4/10 = 0.4. The risk among those with hypertension alone is 6/111 = 0.05, and of those who have no disease is 110/1230 = 0.09.
Thus, we see that patients with pneumonia are more likely than the rest of being hospitalized. If we make the mistake of including only hospitalized patients, our results will be biased relative to the general population, thus observing an association that actually does not exist. This type of spurious association between variables that is caused by an incorrect choice of the sample is known as the Berkson’s fallacy.
We’re leaving…
And here we end for today. We see that how we choose the sample is of paramount importance when generalizing the results of a study. This is what usually happens with clinical trials with strict inclusion criteria, that it is difficult to generalize the results. So there are authors who prefer pragmatic clinical trials, more stuck to everyday reality and more generalizable. But that’s another story…
