Bland-Altman’s method.

Bland-Altman’s method allows calculating the concordance between the results of the measurements of a variable obtained by two methods.
The saying goes that humans are the only animals that trip over the same stone twice. Leaving aside the connotations of using the word animal, the phrase meant that we often make the same mistake, even though realizing it.
Realizing it or not, there are a number of statistical mistakes people make frequently, such us using parameters or statistical tests incorrectly, either through ignorance or, worse, to get more striking results.
A very frequent mistake
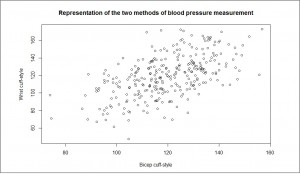
A common case is the use of the Pearson’s correlation coefficient to study the degree of agreement between two ways of measuring a quantitative variable. Here’s an example.
Let’s suppose we want to assess the reliability of a new wrist monitor to measure blood pressure. We take a sample of 300 healthy schoolchildren and measure their blood pressure twice.
The first time, using a conventional biceps cuff, we get a mean systolic pressure of 120 mmHg and a standard deviation of 15 mmHg. The second, with the new device, with which we get a mean of 119.5 mmHg and a standard deviation of 23.6 mmHg. The question we ask is: considering the arm device as the standard reference, is the blood pressure determination with the wrist cuff reliable?.
One could think that to answer this question one might to calculate the correlation coefficient, but it would be a huge mistake. The correlation coefficient measures the relationship between two variables (how one of them varies when the other does), but not their level of agreement. Think, for example, if we change the scale of one of two methods: the correlation will not change, but the agreement will be completely lost.
How then can we know if the new technique is reliable when compared to the standard?. It is logical to think that the two methods will not always coincide, so the first thing to ask is how much is it reasonable that they differ to validate the results. This difference must be defined before comparing the two methods and to establish the necessary sample size for the comparison. In our case, we consider that the difference should not be greater than one standard deviation obtained with the reference method, which is 15 mmHg.

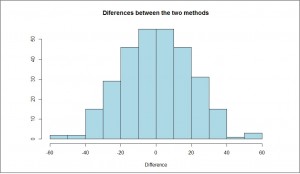
Another possibility is to examine how the differences are. If there is a good agreement, differences between the two methods will be normally distributed around zero. We can see this by the 
Bland-Altman’s method
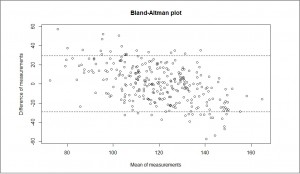
Anyway, we still do not know whether the agreement is good enough. What type of graph can help us?. The one which will give us more information will be that that represents the mean of each pair of measurements against their difference, the so-called Bland-Altman’s graph you can see in the third figure.

The greater the degree of dispersion, the worse the level of agreement between the two methods. In our case, we have drawn the lines that match one standard deviation below and above the mean zero, which we thought were the acceptable limits between the two methods to consider there exist a good agreement.
As you can see, there are many points that fall outside the limits, so we would have to assess whether the new method reproduces the results reliably. Another possibility would be to draw two horizontal lines that encompass the vast majority of points and consider whether this interval is meaningful from a clinical point of view.
The Bland-Altman’s method also allows us to calculate the confidence intervals for the differences and estimate the accuracy of the result. Furthermore, we have to check that the degree of dispersion is uniform. It may be that the agreement is acceptable in certain range of values, but not be so in another (for instance, very high or very low values), in which the dispersion is unacceptable.
This effect can sometimes be corrected by transforming the data (for example, with a logarithmic transformation), but it will always be necessary to consider the usefulness of values of the measurement in that range. Looking at our example, it appears that the wrist blood pressure monitor gives higher to lower systolic values, while giving lower values when the systolic pressure is higher (the points cloud has a discrete negative slope from left to right). The method would be more reliable for systolic around 120 mmHg, but would lose reproducibility when the value of systolic blood pressure goes away from 120 mmHg.
Another use of Bland-Altman’s method is to represent pairs of results of measurements made by the same method or instrument, so as to check the reproducibility of the test’s results.
We’re leaving…
And with that I finish what I wanted to tell you about the Bland-Altman’s method. Before closing, I want to clarify that the data used in this post are entirely invented by me and did not correspond to any real experiment. I’ve generated them with a computer in order to explain the example, so I do not want any wrist blood pressure devices salesman come to me with any complaints.
Finally, say that this method is only used when you want to assess the degree of agreement between quantitative variables. There are other methods, such as the kappa index of agreement, for when dealing with qualitative results. But that’s another story…
