Calculating expected values.

Calculating expected values is done by multiplying the marginals of the cell and dividing by the total of the table. This rule is reasoned.
Do you remember the last post about girls with their level of education and their unhealthy habits?. I´ll do a brief reminder for the sake of those with a loose memory.
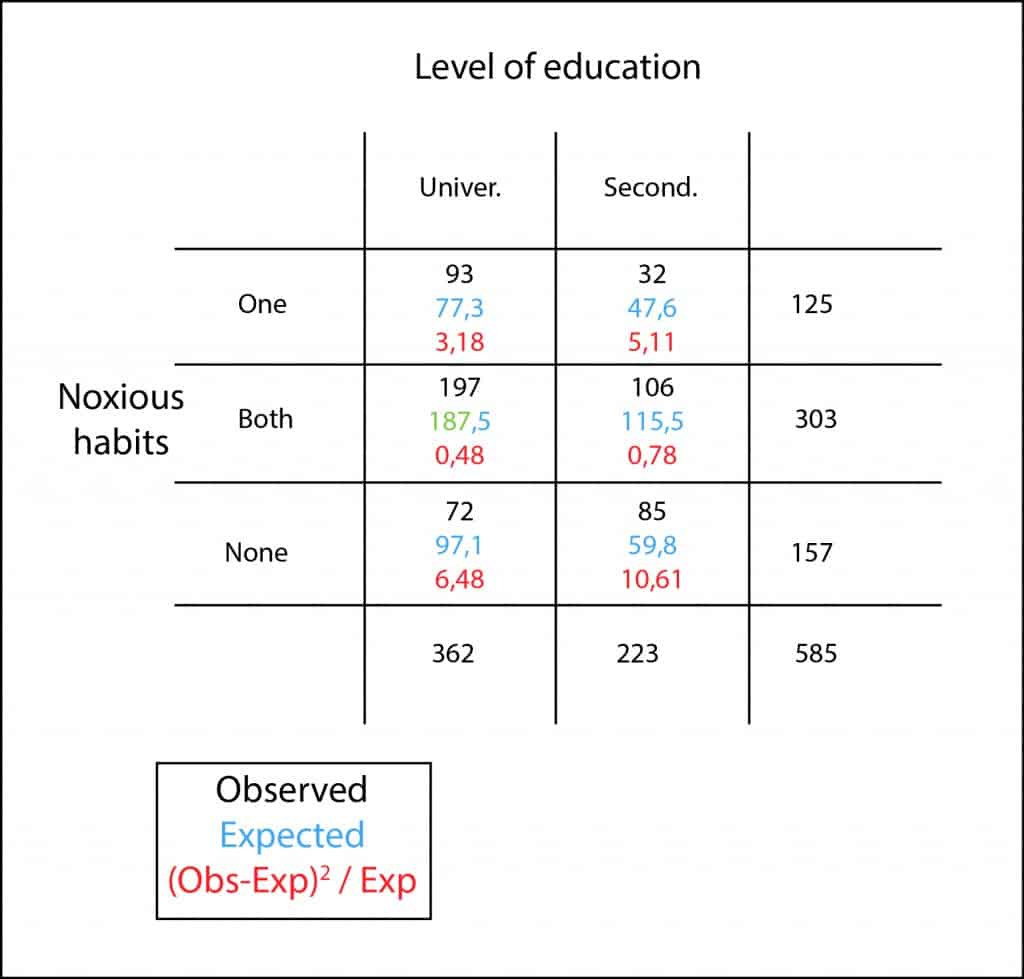
As it happened, we interviewed 585 girls to find out their educational level and if they smoked, drank alcohol, both of them or none. With the results obtained we built the contingency table that I attach again to show you here.
We wanted to know if there was any relationship between the educational level and having bad habits, for which we began to set our null hypothesis that both qualitative variables were independent.
So we proceeded to perform a chi-square test to reach a conclusion. The first thing we have to do was to calculate the expected values of each cell, which is very ease because you just have to multiply the total of the row by the total of the column and divide the result by the total of the table…
Stop right there! Why is that so?. Where does this rule come from?. Do you know why that product divided by the total equals the expected number of the cell?. It’s a good thing to have rules to facilitate our work, but I like to know where things come from and I’m sure that few of you have ever thought about it. Let’s see why.
Calculating expected values
First, let’s keep in mind that we are going to reason under the assumption of the null hypothesis that the variables harmful habits and educational level are independent. We are going to calculate the expected value of the cell corresponding to high school students with two harmful habits.
Being both situations (having studied up to secondary and both smoking and drinking) independent, the probability that both of them happen equals the product of their probabilities:
P(high school and both habits) = P(high school) x P (both habits)
We know that P(high school) will be equal to the total number of girls who studied up to high school divided by the total number of respondents to the interview. Similarly, P(both habits) will be equal to all who drink and smoke divided by the total number of respondents (total of the table). If we substitute the above expression by their values, we get:
P(high school and both habits) = (223/585) x (303/585)
We know now what is the probability of each one to belong to that cell. What is the expected number?. The answer is very simple, the probability of each one multiplied by the total number of girls interviewed:
P(high school and both habits) = 585 x (223/585) x (303/585)
If we cancel out the value 585 in numerator and denominator and simplify the expression, we’ll get:
P(high school and both habits) = (223 x 303) / 585
That is nothing more than the row’s marginal by the column’s marginal divided by the total of the table, being the result, in our example, 115.5.
We’re leaving…
So, you can see where the rule to calculate the expected number of occurrences in a contingency table comes from. Of course, you know that to find out if the variables are or not independent you still have to standardize the squared differences, calculate their sum and get the probability using a chi-square frequency distribution. But that’s another story…
