Confidence interval and sample size.

The characteristics of the standard error of a proportion allow us to make with confidence precise inferences without the need of very large samples.
We all like to know what will happen in the future. So we try to invent things that help us to know what will happen, what will be the result of a certain thing. A clear example is the political elections or surveys to ask people on an issue of interest. So the polls have been invented to try to anticipate the outcome of a survey before happening. Many people do not trust polls, but as discussed below, they are a very useful tool: they allow us to make estimates with relatively little effort.
Consider, for example, that we do a Swiss-style referendum to ask people if they want to reduce their workday. Some of you will tell me that this is a waste of time, since a survey like that in Spain would have a very predictable result, but you never know. In Switzerland they asked and people preferred to continue working longer.
If we wanted to know for sure what will be the outcome of the voting, we’d have to ask everyone what their vote will be, which is impractical to carry out. So we do a poll: we select a sample of a given size and asked them. We obtain an estimate of the final result, with an accuracy that is determined by the confidence interval of the calculated estimator.
But, will the sample have to be very large?. Well, not too much, if it’s well chosen. Let’s see it.
Relation between confidence interval and sample size
Every time we do the poll we obtain a value of the p proportion that will vote, for instance, yes to the proposal we asked for. If we repeated the poll many times, we get a set of values close to each other and probably close to the actual value of the population that we cannot access. Well, these values (result of the different repeated polls) follow a normal distribution, so we know that 95% of the values would be between the value of the proportion in the population plus or minus two times the standard deviation (actually, 1.96 times the standard deviation). This standard deviation is called the standard error, and is the measure that allows us to calculate the margin of error of the estimation by its confidence interval:
95% confidence interval (95 CI) = estimated proportion ± 1.96 x standard error
Actually, this is a simplified equation. If we start from a finite sample (n) obtained from a population (N), the standard error should be multiplied by a correction factor, so that the formula is as follows:
If you think about it for a moment, when the population is large the ratio n / N tends to zero, so that the result of the correction factor tends to one. This is the reason why the sample not needs to be excessively large, and why the same sample size can serve to estimate the results of an election in a little town or in the entire nation.
Therefore, the estimation accuracy is more related to the standard error. What would be the standard error in our example?. As the result is a proportion, we know it follows a binomial distribution, so the standard error is equal to , where p is the proportion obtained and n the sample size.
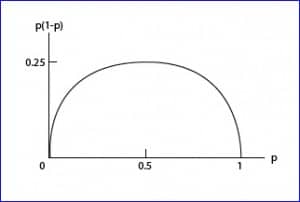
The imprecision (the amplitude of the confidence interval) will be greater the larger the standard error. Therefore, the greater the product p (1-p) or the smaller the sample size, the less accurate will be our estimate and the greater our margin of error.
Anyway, this margin of error is limited. Let’s see why.
We can accurately estimate without the need of a vry large sample

So, for a given value of n, the standard error is maximum when p equals 0.5, using the following equation:
Thus, we can write the formula of the maximum confidence interval:
That is, the maximum margin of error is . This means that with a sample of 100 people we will have a maximum margin of error of plus or minus 10%, depending on the value of p we have obtained (but a maximum of 10%). Thus we see that with a sample that not need to be very large, we can get a fairly accurate result.
We¡re leaving…
And with that we’re done for today. You might ask, after all we have said, why there are polls whose result is different from the definitive result. Well, I can think of two reasons. First, random. We have been able to choose, by chance, a sample that is not centered on the true value of the population (it will happen 5% of the times). Second, the sample may not be representative of the general population. And this is a key factor, because if the sampling technique is incorrect, the results of the survey will be unreliable. But that’s another story…
