Diagnostic odds ratio.

Diagnostic odds ratio is an easy-to-interpret diagnostic test marker that does not depend on the prevalence of the disease.
Today we won’t talk about dragons that take you for a walk if you get on its hump. Nor we’ll talk about men with feet on their heads or any other creature from the delusional mind of Michael Ende. Today we’re going to talk about another never-ending story: that of diagnostic tests indicators.
Assessment of diagnostic tests
When you think you know them all, you can raise a stone to find another beneath it. And why are there so many?, you may ask. Well, the answer is simple. Although there’re indicators that know very well how to interpret how a diagnostic test manages healthy and sick people, investigators are still looking for a good indicator, unique, that give us an idea about the diagnostic capability of a test.

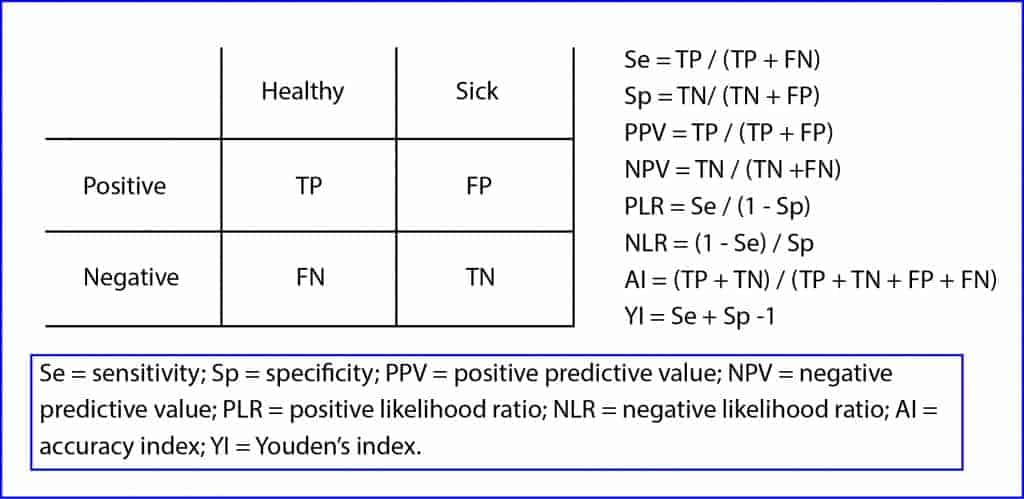
The problem is that most of them partially assess the ability of the test, so we need to use them in pairs: sensitivity and specificity, for example. Only the last two of the mentioned indicators can function as single ones. The accuracy index measures the percentage of correctly diagnosed patients, but it treats equally positives and negatives, true or false. Meanwhile, Youden’s index adds the patients misclassified by the diagnostic test.
In any case, it’s not recommended to use either the accuracy or Youden’s index in an isolated way when evaluating diagnostic tests. Moreover, the latter is a term difficult to translate to a tangible clinical concept as it’s a linear transformation of sensitivity and specificity.
At this point it’s easy to understand how we’d like to have a single indicator, simple, easy to interpret and not dependent on the prevalence of the disease. It would certainly be a good indicator of the ability of the diagnostic test that would avoid us of having to resort to a pair of indicators.
Diagnostic odds ratio
And at this point is when some brilliant mind has thought about using a well-known and familiar indicator such as the odds ratio to measure the capabilities of a diagnostic test. Thus, we can define de diagnostic odds ratio (DOR) as the ratio of the odds that the patients tests positive with respect to the odds of testing positive being healthy. As this is quite a tongue-twister, we’ll discuss the two components of the ratio.
The odds that the patient tests positive versus negative is simply the quotient among true positives (TP) and false negatives (FN): TP / FN. Moreover, the odds that a healthy tests positive versus negative is the quotient among false positives (FP) and true negatives (TN): FP / TN. And seeing this, we just have to define the ratio of the two odds:
DOR can also be expressed in terms of predictive values and likelihood ratios, according to the following expressions:
As any odds ratio, the possible values of DOR range from zero to infinity. The null value is one, which means that the test has no discriminatory capacity among healthy and sick. A value greater than one indicates discriminatory ability, which will be greater the higher the value is. Finally, values between zero and one will indicate that the test not only not discriminate well among healthy and sick, but that it incorrectly classifies them and yield more negative values among sick than among healthy people.
DOR is a global measure that is easy to interpret and does not depend on the prevalence of the disease, although it must be said that it can vary among groups of patients with different severity of their disease.
Finally, add to its advantages the possibility of constructing its confidence interval from the contingency table using this little formula that I show you:
Yes, I’ve seen the log, but this is the way with odds ratios: as odds are asymmetrical around the null value, these calculations must be done with logarithms. So, once we have the standard error, we can calculate the interval as follows:
We just have to apply the antilogarithm to the limits of the interval we got with the formula (the antilog is to raise the number e to the limits obtained).
We’re leaving…
And I think that this is enough for today. We could go more. DOR has many more virtues. For example, it can be used with test with continuous results (not just positive or negative), since there’s a correlation between DOR and the area under the ROC curve of the test. Furthermore, it can be used in meta-analysis and in logistic regression models, allowing the inclusion of variables to control the heterogeneity of the primary studies. But that’s another story…
