Goodness of fit to test a normal.

Shapiro-Wilk and Kolmogorov-Smirnov tests are the most commonly used contrast tests to check the goodness of fit to a normal distribution of our data. Its implementation is described step by step and its equivalence in graphical methods such as the theoretical quantile graph and the cumulative density function graph.
Imagine that you find yourselves in the crowded lobby of an ancient theater. The crystal chandeliers tinkle softly as an expectant crowd murmur about the show that is about to begin, eager to uncover the secrets that lie behind the velvet curtain.
Inside, the spotlights turn on and the curtain slowly rises. On the stage, an old magician prepares to demonstrate some of the most enigmatic acts of his repertoire, which will astonish the devoted audience unable to comprehend the magic that gives rise to the illusion.
However, we all know that behind the spectacle, the simplicity of the trick that allows it, which we cannot even imagine, surely hides. All this comes up because, although it may seem hard to believe, something similar occurs with the goodness of fit tests to a normal distribution that we apply to our data.
Just like in the most complex escapism acts, where chains and locks play an essential role in the art of illusionism, these tests hide under their mathematical complexity a simplicity and elegance that can be visualized and understood through simple graphs.
So, do not be overwhelmed by this tangle of calculations and theories. In this post, we will see how the complexity of these tests hides a simple and elegant plot. Keep reading, and you will discover that the true magic is not only on stage but in the subtle art of handling data behind the scenes, where the extraordinary becomes comprehensible.
Goodness of fit tests to a normal distribution
We have already seen in a previous post the characteristics of the normal distribution and its central role in our hypothesis testing. This is because parametric hypothesis tests often require that the data fit a normal distribution.
All methods that try to verify this assumption analyze how much the distribution of our data (observed in our sample) differs from what we would expect if the data came from a population in which the variable followed a normal distribution with the same mean and standard deviation observed in the sample data.
For this verification, we have three possible strategies: methods based on hypothesis tests, those based on graphical representations, and so-called analytical methods. Today, we are going to focus on the first, specifically on the goodness of fit tests to a normal, particularly the Shapiro-Wilk and Kolmogorov-Smirnov tests.
Let’s first look at their less friendly face, the one that shows us all their mathematical complexity.
Shapiro-Wilk Test
This is the goodness of fit test to a normal that is usually used when the sample is small, say less than 30 elements.
Like any other parametric contrast test, the Shapiro-Wilk test is based on the calculation of a statistic called W, which follows a certain probability distribution. Once W is calculated, we can obtain the probability of obtaining by chance a value greater or equal to the observed under the assumption of the null hypothesis that says that the data follow a normal.
This probability is effectively our p. If p < 0.05 (or the value we choose to establish statistical significance), we will reject the null hypothesis and assume that the data do not fit a normal distribution. On the contrary, if p > 0.05, we will stick with the null hypothesis and cannot deny that the data are normal (you know, not rejecting the null hypothesis is not synonymous with proving it, especially with tests with low power like this one).
The difficulty of the Shapiro-Wilk test is that the W statistic does not follow a simple standard distribution such as the normal or the Student’s t. Instead, the distribution of W is unique for each sample size n, depending on the properties of the quantiles of the standard normal distribution and our sample data.
This particular distribution for each n is determined through simulations and complex mathematical calculations, so no one thinks of doing the calculations by hand but rather resort to tables with precalculated W values or, better, to statistical packages that do all this in the blink of an eye without complaints or effort.
An example, step by step
To better understand the whole process, we will use a set of fictitious data that we will generate using the R program.
Let’s assume we have a sample of 30 records with the following values: 23, 9, 25, 11, 11, 8, 6, 9, 22, 12, 13, 18, 9, 14, 12, 11, 7, 18, 17, 7, 11, 10, 24, 14, 9, 6, 16, 14, 6, and 8.
This data set has a mean of 12.66 and a standard deviation of 5.5. Additionally, allow me a small trick, because I have designed the data knowing that they do not follow a normal distribution, but an exponential one, which will be more educational for our explanations.
Now we will calculate the W statistic and see if it is significant. Here is where the most arduous part of working with this unfriendly statistic begins, whose formula is as follows:
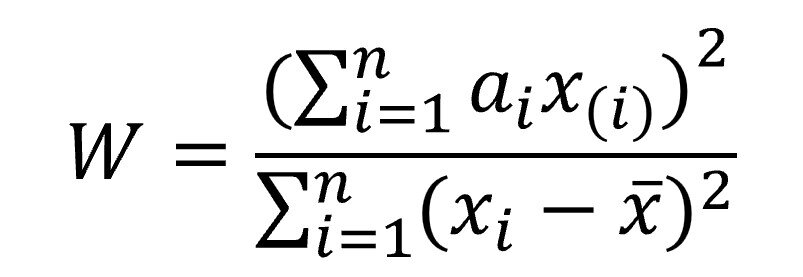
Let’s explain the components of the above formula because it’s crucial not to confuse the terms, as x(i) and xi are quite different.
The first thing we need to do is sort our data from smallest to largest. Once done, we calculate the absolute values of the differences between the first (the lowest value) and the last (the highest value), between the second and the penultimate, and so on, with all the data, thus obtaining a set with half the elements of the original data with the absolute differences of the pairs. This represents x(i), each of these differences.
On the other hand, xi represents each element of the original data series.
Having explained this, we see that the numerator is a weighted sum of these differences between pairs of data, each of which will be multiplied by ai, which are a series of coefficients obtained from the quantiles of the standard normal distribution and the number of observations (they are the ones that weight the differences of the ordered pairs).
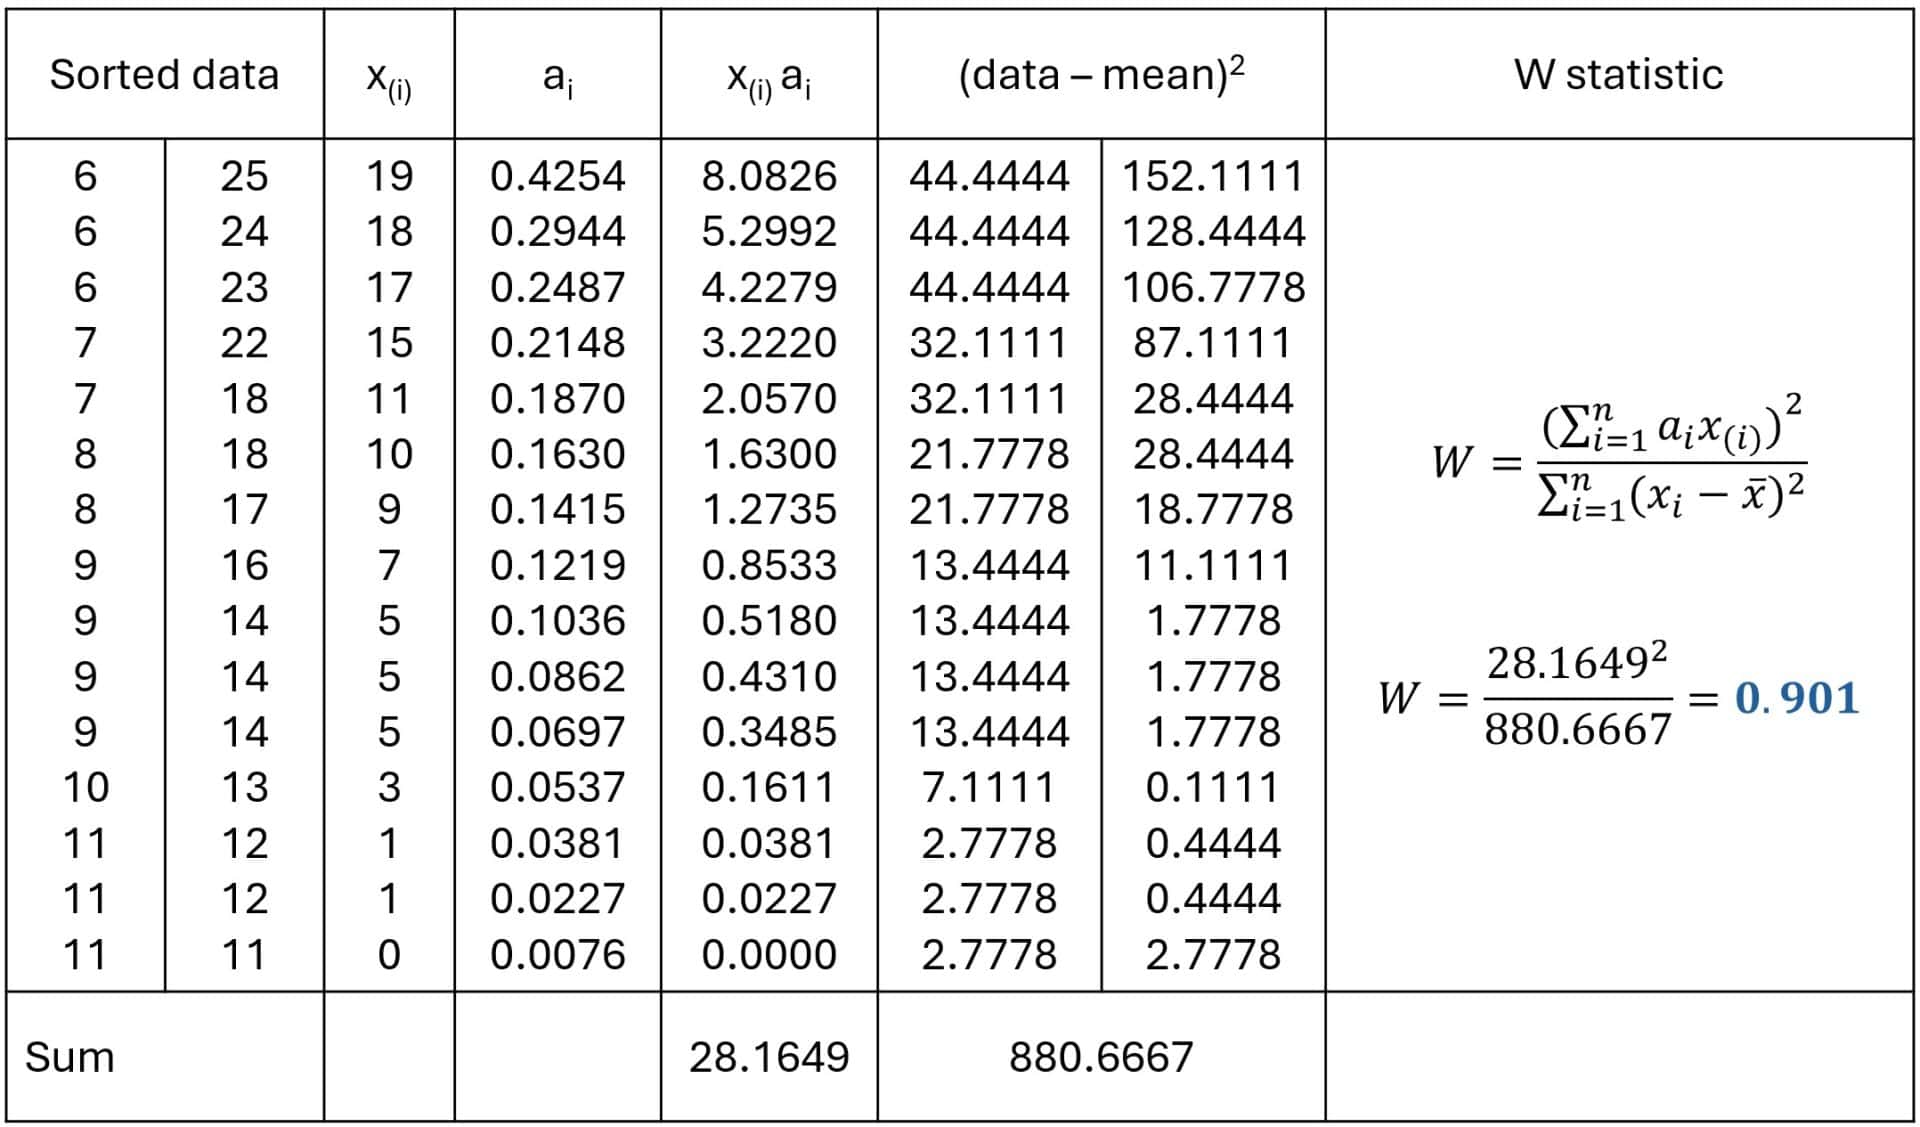
The denominator is simpler: the sum of the squares of the differences of each value with the mean of the distribution. Let’s now calculate the value of W. To do this, we will calculate the necessary terms, as shown in the attached table.
Step 1. Sort the data and calculate the differences.
The first column of the table shows the ordered data. I have divided the column in two, and the data go from smallest to largest in descending order in the first half and in ascending order in the second. I do this to facilitate the calculation of the differences, which are in the second column.
Step 2. Obtain the ai coefficients.
Calculating the coefficients has some complexity, as it involves the covariance matrix of the quantiles of the normal order and its inverse, according to a formula even more unfriendly than that of W, which I will not show here.
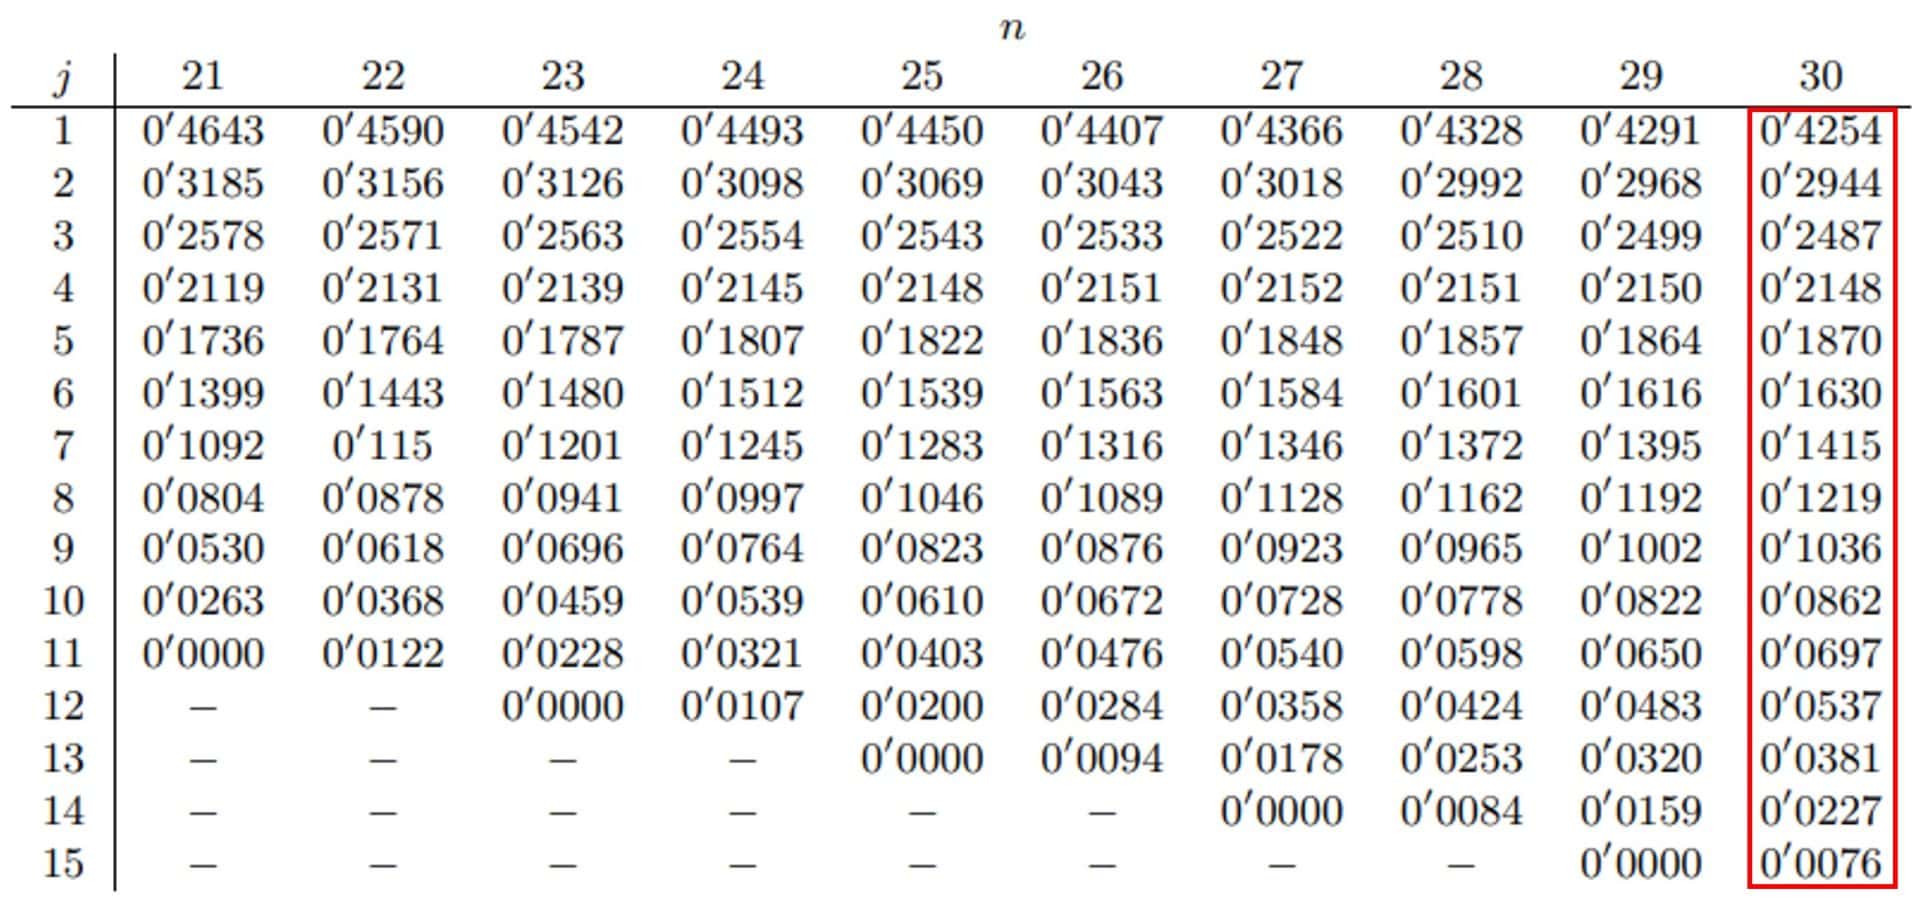
Therefore, it is usual to resort to a table of precalculated values or to a statistical program capable of obtaining and showing them. I am going to take the data from one of the tables available on the Internet and attach it so you can see it well.
I select the 15 coefficients that the table gives for when the sample is of 30 elements (15 differences of pairs) and pass them to the third column.
Step 3. Calculate the W statistic.
First, we calculate the components that we are missing from the W formula, which are the sum of the products of the coefficients by the differences of the pairs, which you can see in the two columns.
Finally, in the column on the right, we substitute in the formula the values calculated for the numerator and the denominator and obtain W, which has a value of 0.901.
Step 4. Resolve the hypothesis test.
We have to decide if this value is statistically significant or if we could have obtained it by chance. If we do it manually, the simplest thing is to look for a table with the critical values of W for each sample size and level of significance. You can see one on the same page where we found the coefficients.
For a value of n = 30 and p = 0.05, the critical value of W = 0.927. Since our value of W is lower than the critical value, we can reject the null hypothesis and conclude that the data do not follow a normal distribution. The value of p will be less than 0.05, although with these manual methods it is better to be satisfied without the exact value, as it is complex to calculate.
Kolmogorov-Smirnov Test
Now, let’s move on to the Kolmogorov-Smirnov test, almost as unfriendly and complex as the previous one.
One advantage of this test is that it allows checking the goodness of fit to any probability distribution, not only to the normal. However, it has two disadvantages that counteract this advantage.
First, it is needed to know the mean and standard deviation of the population from which the sample data come, which we usually do not know. To try to solve this, the Lilliefors’ correction is applied to compare the goodness of fit with to the normal distribution by tabulating the statistic with sample estimates of the mean and standard deviation.
But this does not work very well, which causes its second disadvantage: it is a test with low power, so it has a great tendency to not to be able to reject the null hypothesis, which, like in the Shapiro-Wilk test, assumes that the data follow a normal distribution.
Let’s see a practical example of how the contrast is done with this test, using the same data as in the previous example, as you can see in the table that we will fill out with the data we calculate.
Another Example, Step by Step
This test calculates a statistic called D, according to the formula I show you below:

Let’s see what the components of the formula mean. xi represents each of the values of the sample, ordered from smallest to largest. Fn(xi) is an estimator of the probability of observing, in our sample, values less than or equal to xi. Finally, F0(xi) is the probability of observing values less than or equal to xi when the null hypothesis is true, which, in our example, will be met when the data are normally distributed.
Thus, D will be equal to the greatest absolute difference between the observed cumulative frequency and the theoretical frequency obtained from the probability distribution specified under the null hypothesis.
Now all that’s left is to do the calculations.
Step 1. Sort the data.
We have already done this from the previous example. You can see it in the first column of the table, although now all are in descending order from top to bottom.
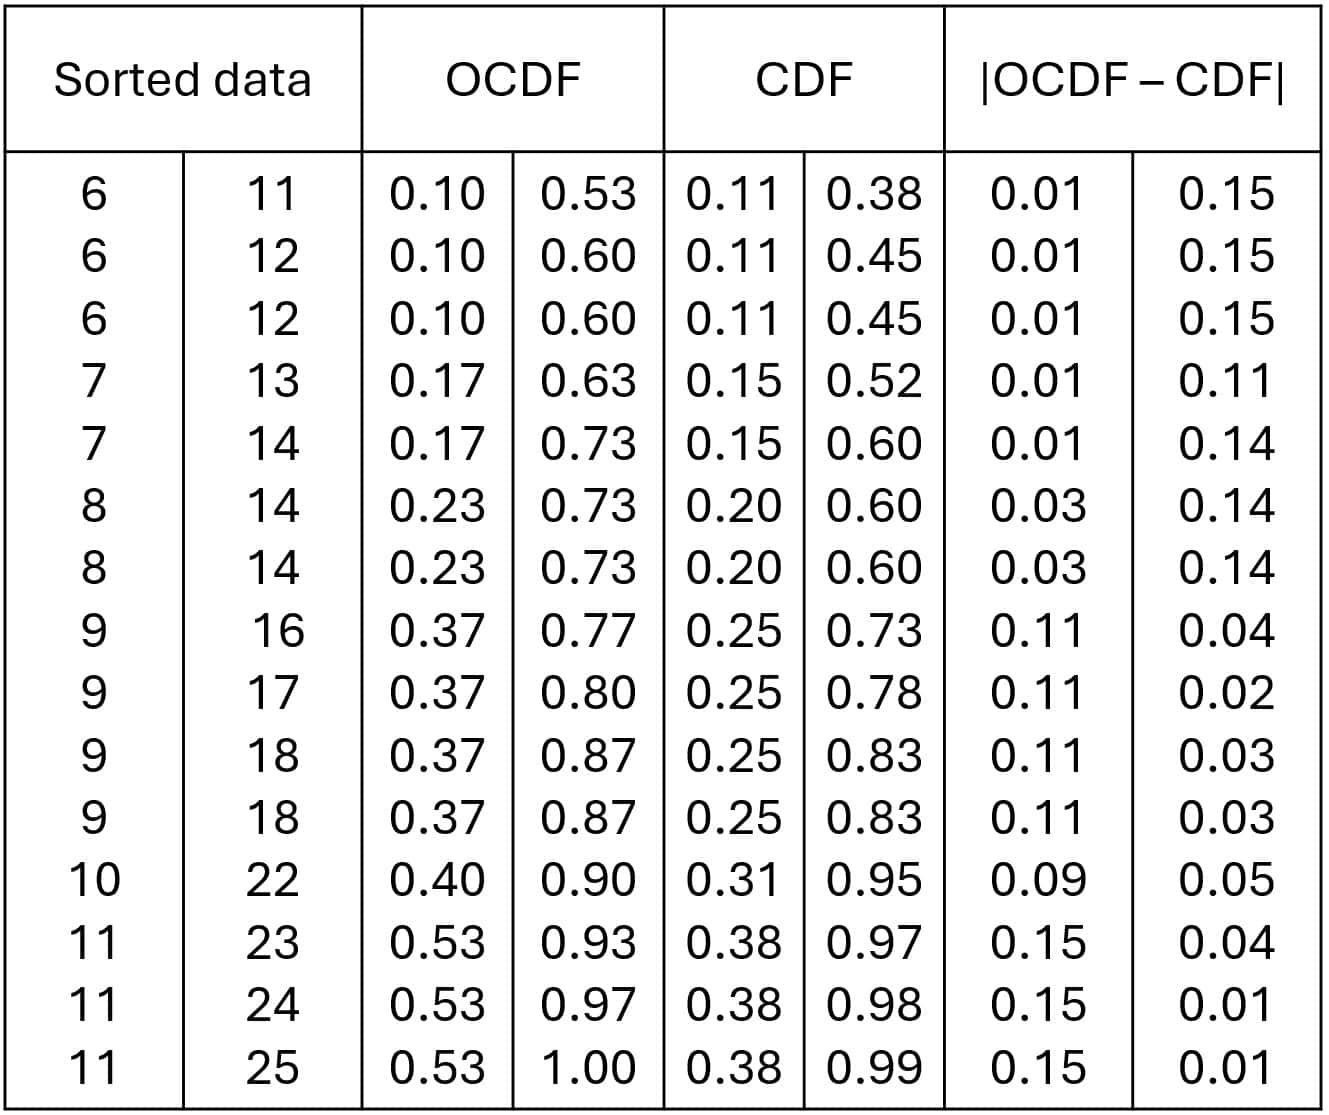
Step 2. Calculate the empirical cumulative distribution function.
This is the observed cumulative frequency in our data (OCDF). It is shown in the second column.
Step 3. Calculate the theoretical cumulative function.
This is the theoretical cumulative frequency (CDF) if the data follow a normal distribution.
Logically, this step and the previous one can be done by hand, but I have used the R program.
Step 4. Calculate the absolute differences.
We subtract the differences between the cumulative frequencies and keep the absolute value. We see that the maximum value is 0.15. This is the value of the D statistic.
Step 5. Resolve the contrast.
The calculation of the critical value for D is complex, so we turn again to tabulated data. You can see an example in this link. The value of D for alpha = 0.05 and n = 30 is 0.24.
In this case, we will reject the null hypothesis if our D is greater than the critical value. As our value of D = 0.15 is less than the critical value, we cannot reject the null hypothesis and assume that the data follow a normal distribution.
Wait a moment! Didn’t I tell you that I had made a little trick and generated a series of data following an exponential distribution? You have just seen live the major drawback of these contrast tests: their low power and the “ease” with which they assume the normality of the data.
Therefore, whenever we cannot reject the null hypothesis, it is advisable to complement the contrast using some graphical means such as the histogram or the theoretical quantiles graph.
Behind the scenes
The few of you who have followed reading until here may wonder what was the point of the story at the beginning about magicians, the spectacular nature of their tricks, and the simplicity that usually lies behind them.
Well, it turns out that these two tests do something much simpler behind the curtains: they resort to graphical methods to do their magic.
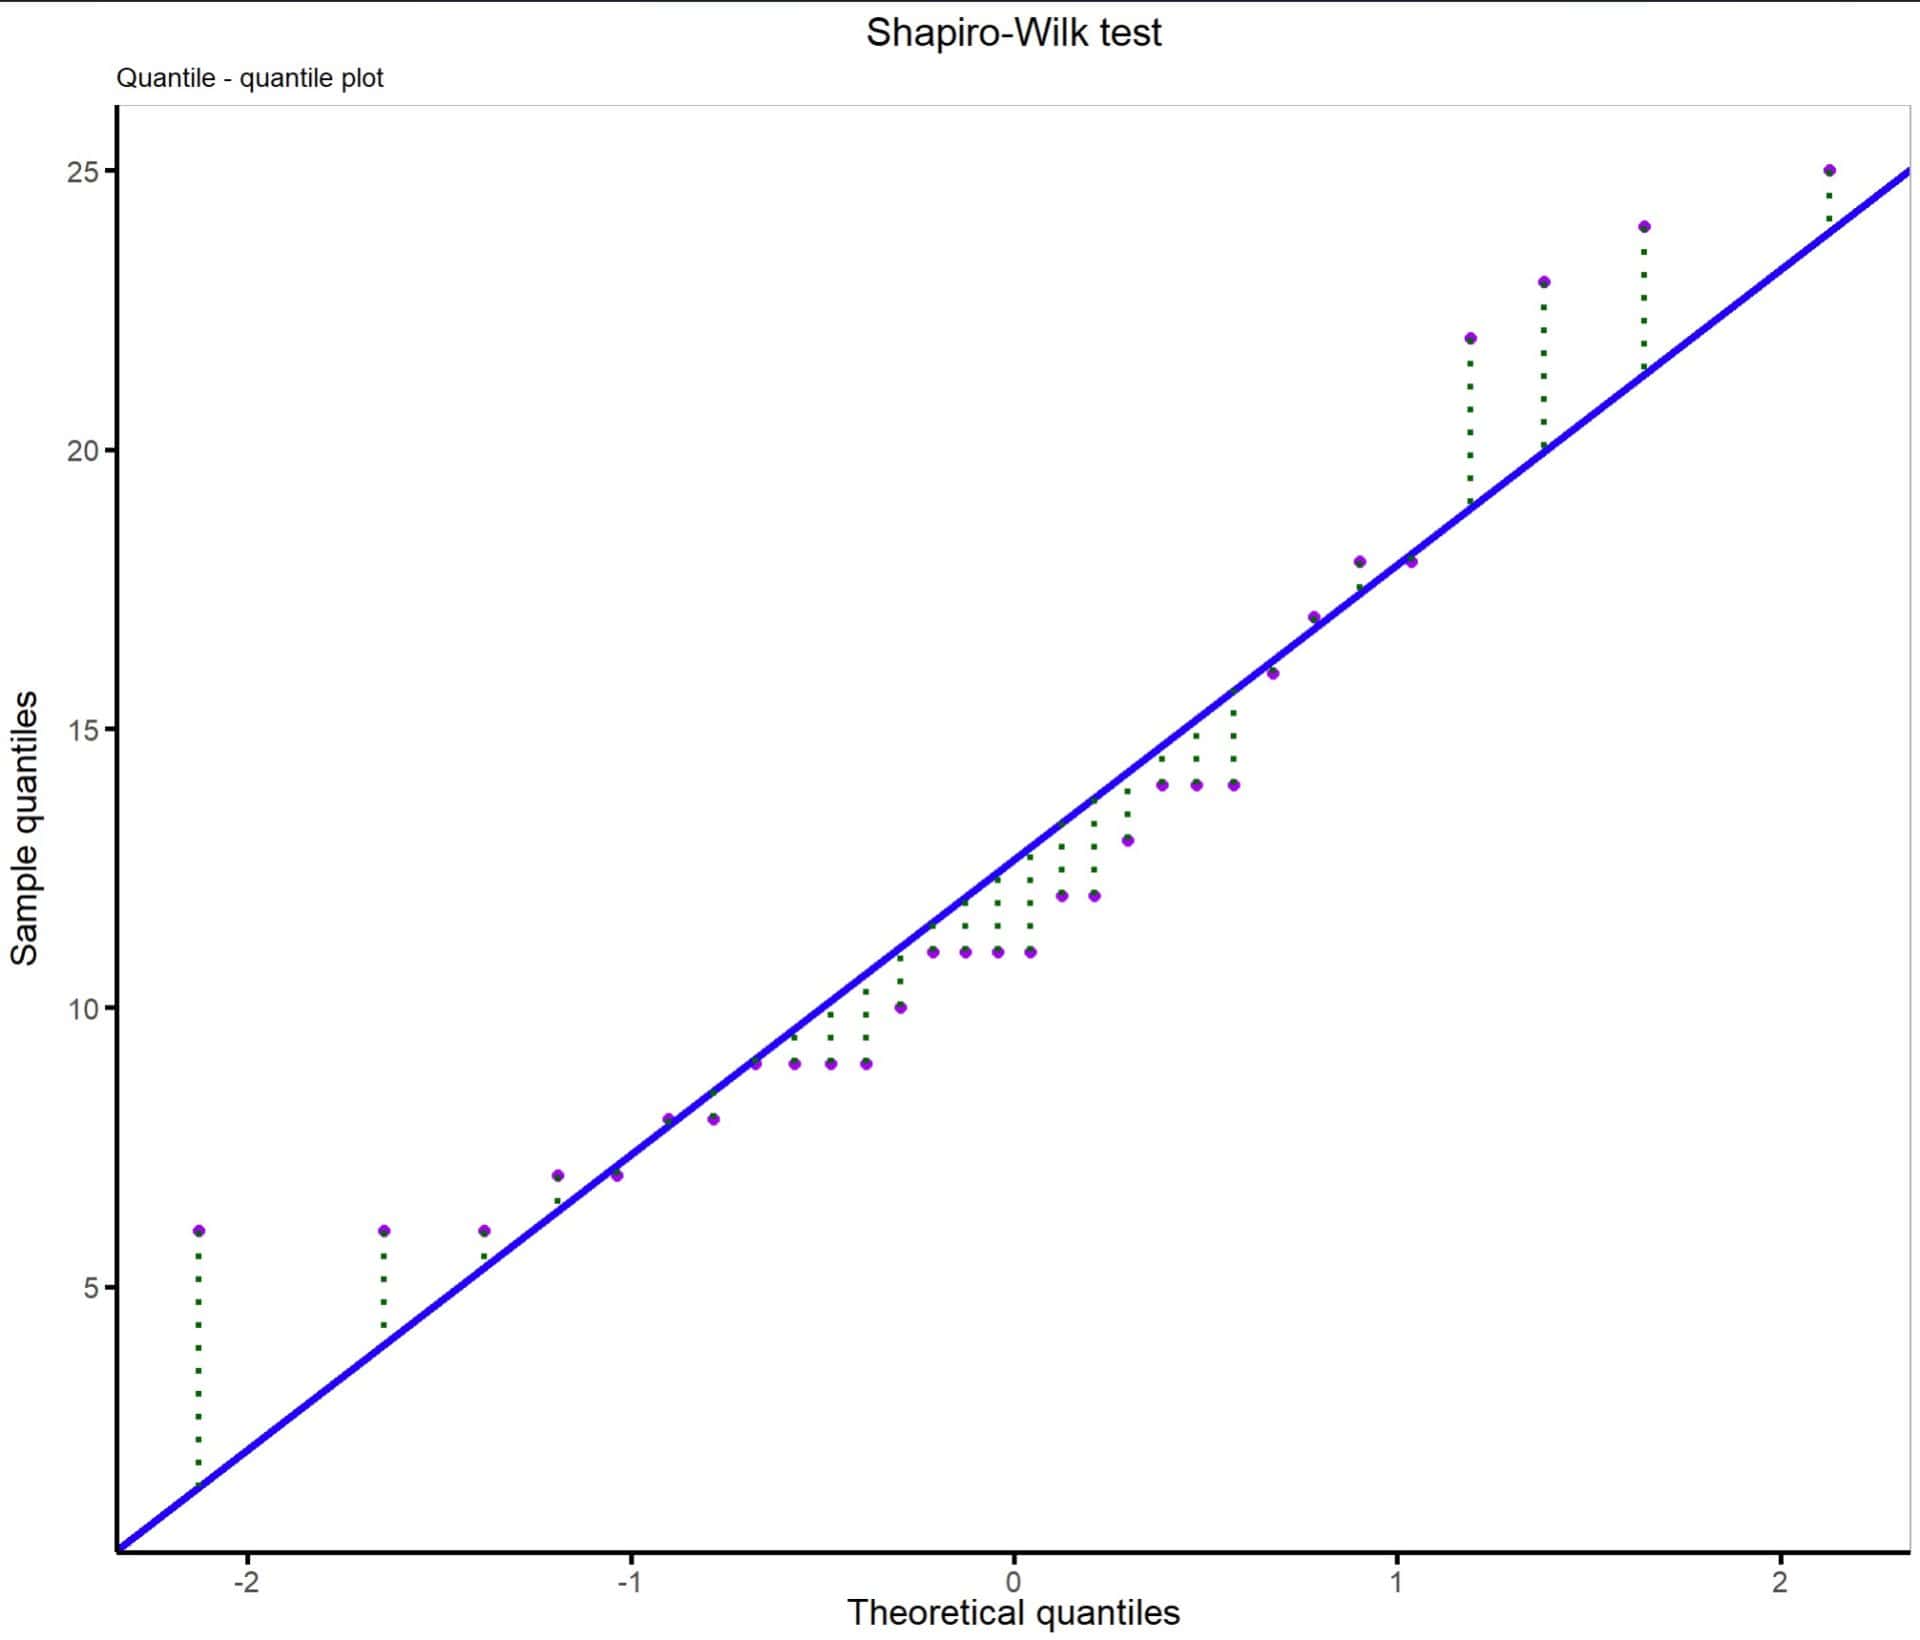
Behind the scenes, the Shapiro-Wilk’s test imagines a theoretical quantiles graph and compares the distances between the real data and the line that marks where the data should be if they were distributed according to a normal. You can see it in the first graph.
It is the same thing we do to complement the numerical contrast when the null hypothesis is not rejected, but with the difference that we do it subjectively, and the contrast method does a quantitative analysis (although not very powerful, as we have seen).
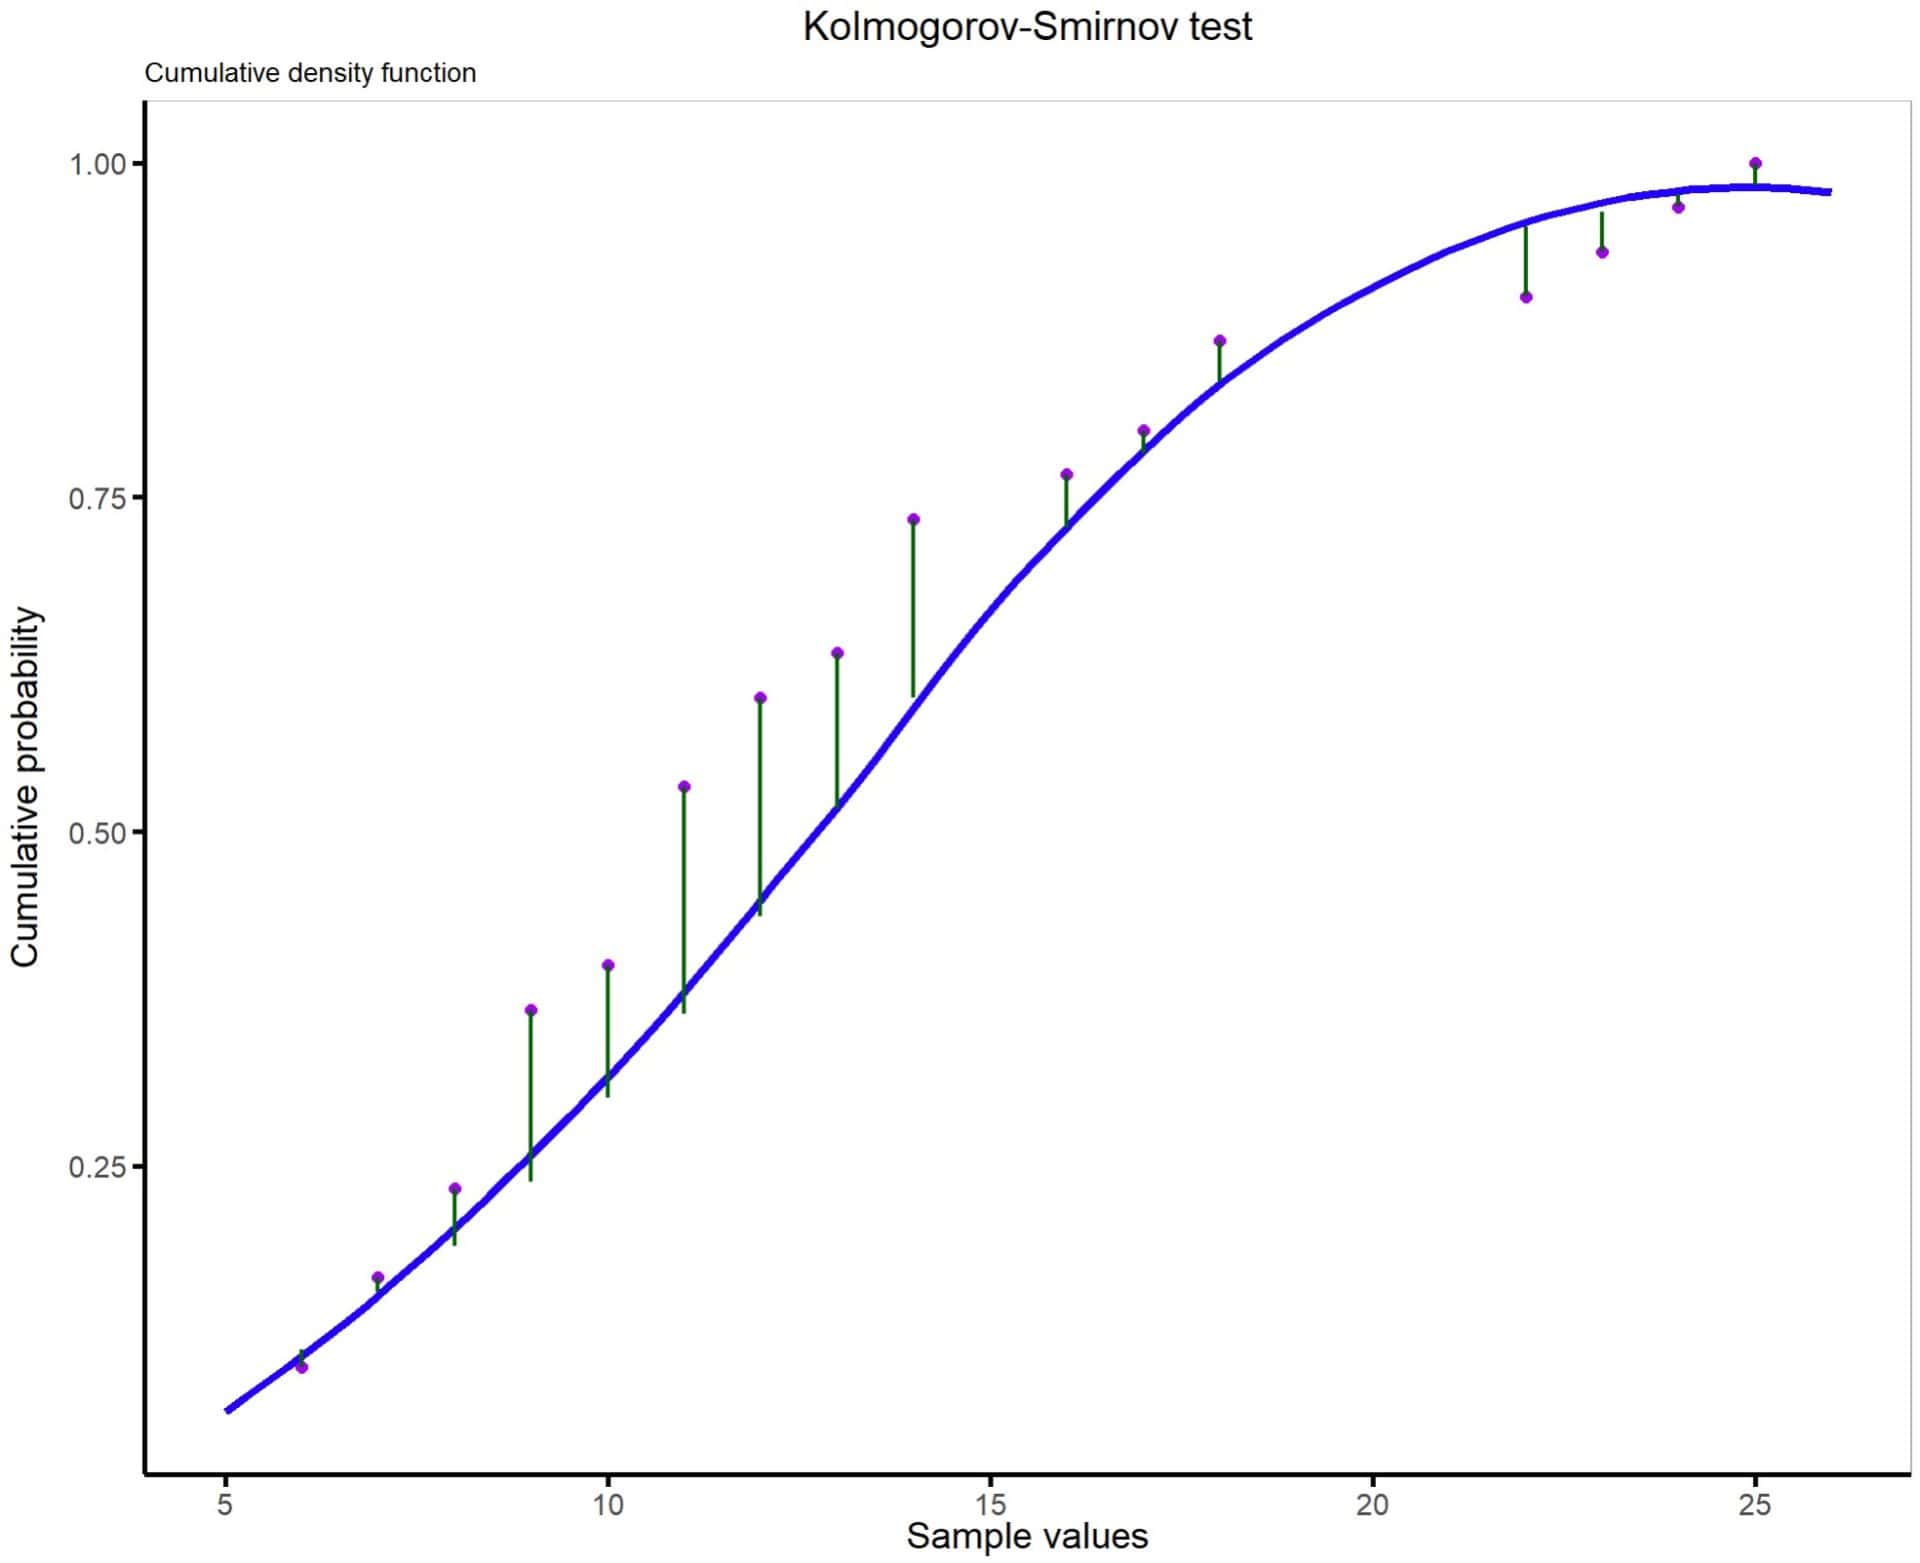
The Kolmogorov-Smirnov’s test does something similar but resorts to the graph of the probability or cumulative density function of the theoretical data if these followed a normal. Here it compares the distances between the real data and the cumulative probability line, as you can see in the second graph.
And this is what hides behind all the number jumble we have seen in the two previous examples. I wonder if behind David Copperfield’s performances, tricks of this beauty are hidden. Unlike making a plane levitate or disappearing someone, here all that “disappears” are our doubts about the data distribution (of course, always with a margin of error), and no magic is needed, just a bit of statistics!
We Are Leaving…
And with this, I think it’s time to air out our heads a bit, which must be smoking.
We have seen how to manually perform two goodness of fit tests to a normal, the Shapiro-Wilk’s test, and the Kolmogorov-Smirnov’s test. Needless to say, no one should think of doing these tests by hand. The examples are made to understand their operation, but we will always use a statistical program to carry them out.
I used R even to do the manual calculations. Risk sports lovers can download the script at this link and repeat the experiment on your own.
To conclude, we can say that the Shapiro-Wilk’s test may be the most suitable when the sample sizes are small (<30), while we will prefer the Kolmogorov-Smirnov’s test when the samples are larger (despite being the less powerful of the two), always applying the Lilliefors’ correction if we do not know the mean and standard deviation in the population.
Finally, we must not forget to complement the contrast with another method when we cannot reject the null hypothesis of normality, as we have seen, these are tests with low power. The simplest thing is to resort to graphical methods, although there are other more sophisticated analytical methods for those who like to complicate their lives. But that’s another story…
