Mean’s confidence interval.

Obtaining a mean, the concept of standard error and the calculation of the mean’s confidence interval are described.
Our life is full of uncertainty. There’re many times that we want to know information that is out of our reach, and then we have to be happy with approximations. The problem is that approximations are subject to error, so we can never be completely sure that our estimates are true. But do we can measure our degree of uncertainty.
This is one of the things statistics is responsible for, quantifying uncertainty. For example, let’s suppose we want to know the mean cholesterol levels of adults between 18 and 65 years from the city where I live in. If we want the exact number we have to call them all, convince them to be analyzed (most of them are healthy and won’t want to know anything about analysis) and make the determination to every one of them to calculate the average we want to know.
The problem is that I live in a big city, with about five million people, so it’s impossible from a practical point of view to determine serum cholesterol to all adults from the age range that we are interested in. What can we do?. We can select a more affordable sample, calculate the mean cholesterol of their components and then estimate what is the average value in the entire population.
Calculating the mean

Logically, as the sample is large enough, the average value of the population will probably be close to that of 165 obtained from the sample, but it’s also very unlikely to be exactly that. How can we know the value of the population? The answer is that we cannot know the exact value, but we can know what the approximate value is. In other words, we can calculate a range within which the value of my unaffordable population is, always with a certain level of confidence (or uncertainty) that can be settled by us.
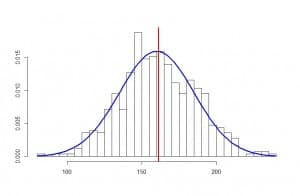
Let’s consider for a moment what would happen if we repeat the experiment many times. We would get a slightly different value every time, but all of them should be similar and close to the actual value of the population. If we repeat the experiment a hundred times and get a hundred mean values, these values will follow a normal distribution with a specific mean and standard deviation.
Standard error
Now, we know that, in a normal distribution, about 95% of the sample is located in the interval enclosed by the mean plus minus two standard deviations. In the case of the distribution of means of our experiments, the standard deviation of the means distribution is called the standard error, but its meaning is the same of any standard deviation: the range between the mean plus minus two standard errors contains 95% of the means of the distribution.
This implies, roughly, that the actual mean of our population will be included in that interval 95% of the times, and that we don’t need to repeat the experiment a hundred times, it’s enough to compute the interval as the obtained mean plus minus two standard errors. And how can we get the mean’s standard error? Very simple, using the following expression:
standard error = standard deviation / square root of sample size
Mean’s confidence interval
In our example, the standard error equals 1.12, which means that the mean value of cholesterol in our population is within the range 165 – 2.24 to 165 + 2.24 or, what is the same, 162.76 to 167.24, always with a probability of error of 5% (a level of confidence of 95%).
We have thus calculated the 95% confidence interval of our mean, which allow us to estimate the values between which the true population mean is. All confidence intervals are calculated similarly, varying in each case how to calculate the standard error, which will be different depending on whether we are dealing with a mean, a proportion, a relative risk, etc.
We’re leaving…
To finish this post I have to tell you that the way we have done this calculation is an approximation. When we know the standard deviation in the population we can use a standard normal distribution to calculate the confidence interval. If we don’t know it, which is the usual situation, and the sample is large enough, we can make an approximation using a normal distribution committing little error. But if the sample is small the distribution of our means of repetitive experiments won’t follow a normal distribution, but a Student’s t distribution, so we should use this distribution to calculate the interval. But that’s another story…
