Sample size for estimating a mean.

The sample size required to estimate a population mean depends on the desired level of confidence and precision, in addition on the variable’s variance in the population.
There is no doubt that the mean, and we are referring to the arithmetic mean, is the most widely used measure of central tendency. What few know, however, is its noble origin.
At present, to make it easier from a didactic point of view, we say that the arithmetic mean, also called the average, is the result obtained by adding all the values of a sample and dividing it by the number of said values.
But it was not always so easy to define what an arithmetic mean is. We must go back to the third century BC when a great genius ahead of his time, the wise Archimedes, took the matter of the average seriously.
Until the genius with the most famous principle in history thought about it, people had used the concept of arithmetic mean intuitively. But this changed.
Archimedes had used in many of his works the principle of the balance for the discovery of geometric properties and he took it as a fundamental epistemological element in the construction of his knowledge for the calculation of the center of gravity, which is nothing other than a form of average.
From the use of the balance and the center of gravity arise the concepts of excess and defect between two quantities, which tend to balance at a midpoint. And this balance between excess and defect is the sustenance of our arithmetic mean.
Seeing the noble origin of the arithmetic mean, it should not be surprising that it is so present in such fundamental mathematical aspects as the basis of the differential calculus or the central limit theorem.
But we are going to forget about stories and get into the matter. Today we will see what sample size we need if we want to estimate the mean of a certain variable in a population using a sample obtained from that population.
Estimation of a mean
Suppose we want to do a health program in our city to control hypercholesterolemia. In order to plan our program well, we are interested in knowing the mean value of serum cholesterol in our population.
The most exact thing would be to make an analysis to each one of the inhabitants of the city, to add the values of all the determinations and to divide between the total of analyzed samples. This approach may be convenient if we live in a town with 50 inhabitants, but imagine that we live in Calcutta: we would have to do more than 14 million cholesterol determinations, which is clearly impractical.
In cases like this, what is usually done is to select a sample of individuals that is representative of the target population (city dwellers) and measure the serum cholesterol concentration in the individuals in the sample, which is more accessible.
Once we have the sample mean value, we will make our estimate of the value that the mean will have in the inaccessible population, always with a certain degree of variability or error, which we can also determine.
And what is the sample size necessary to estimate a mean in a population? The answer to this question depends on a number of factors that we will discuss below.
Factors influencing the sample size for estimating a mean
To calculate the sample size for estimating a mean, we must first establish the level of confidence and precision that we want our estimate to have. Furthermore, the required sample size will vary according to the dispersion of the variable in the population.
Confidence level
Simply put, though not entirely accurate, the confidence level refers to the probability that the confidence interval of our estimate includes the true population value that we cannot measure directly.
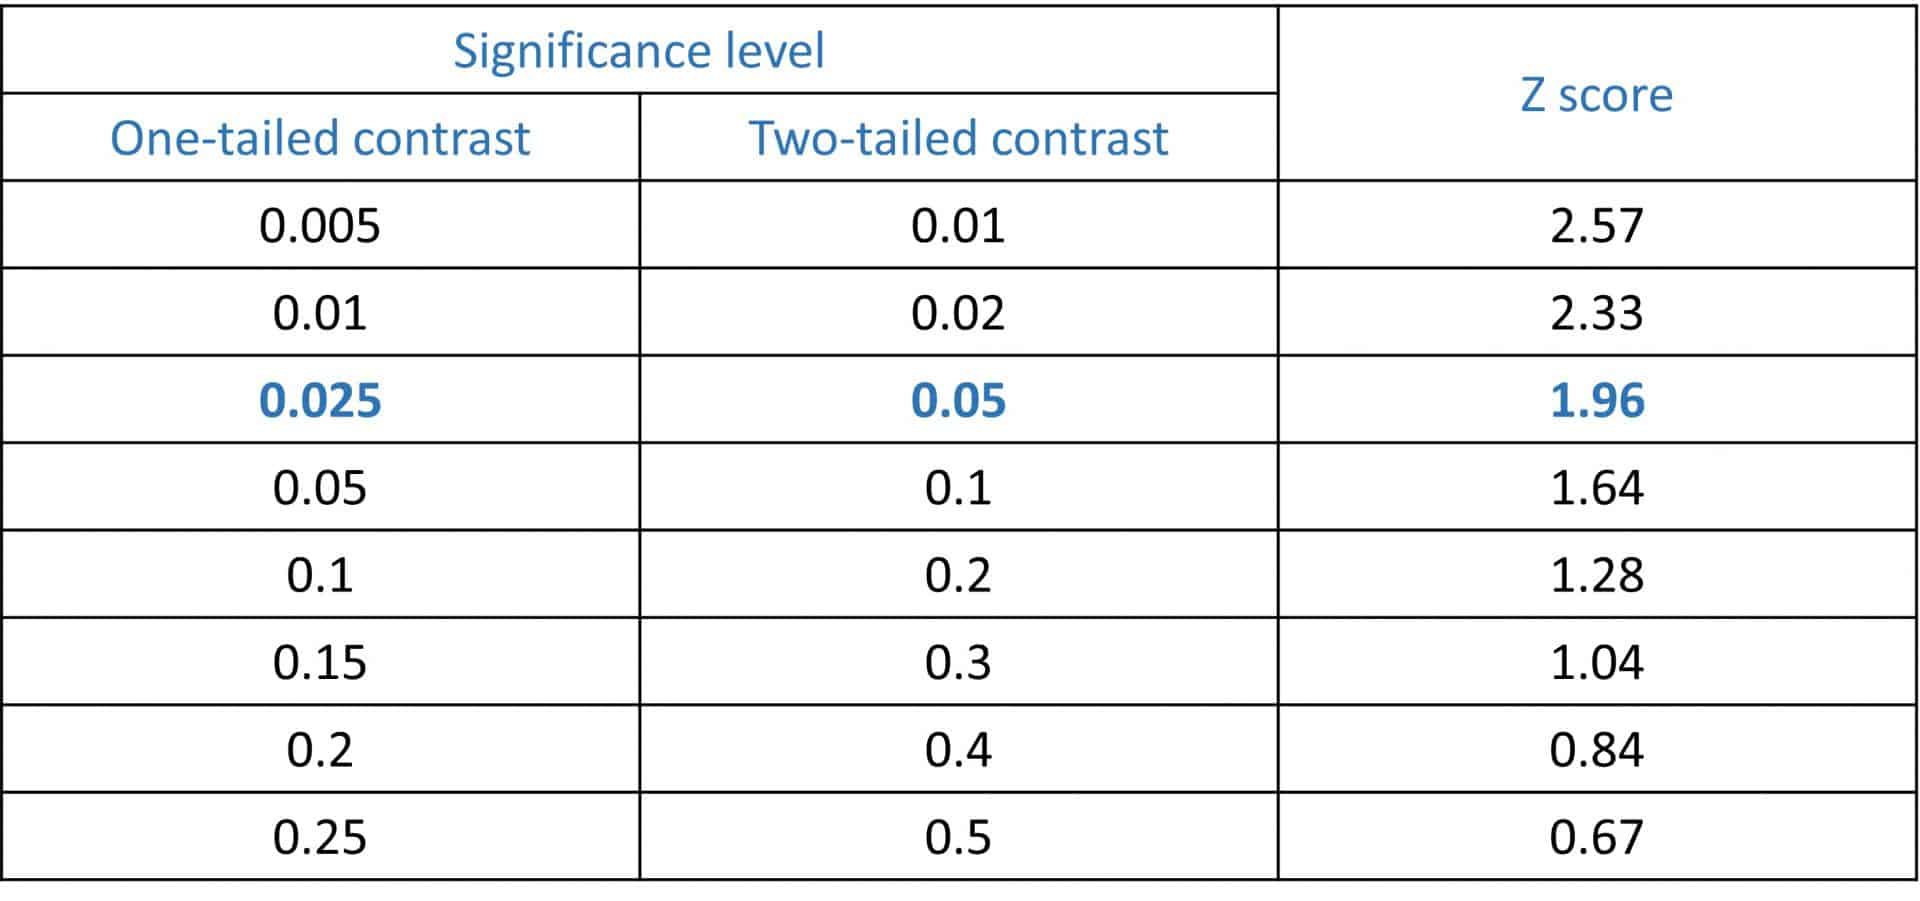
The usual thing is to choose a 95% confidence, with which we will estimate a point value with its 95% confidence interval. This is done using the standardized score that leaves 5% of the standard normal population out of range. This value is what is known as Zα, where α is the level of significance (the complement of the confidence level).
Thus, if we choose a 95% confidence, α will be worth 0.05 and a Z of 1.96 will correspond to it for a bilateral contrast. In the attached table I show you some of the most used Z values, although they can be calculated using a normal distribution.

Remember that this choice is made simply by agreement and that, according to each individual case, we can choose the level of confidence we want. Of course, it must be taken into account that the sample size increases directly proportionally to the square of the Zα value: the higher the level of confidence, the lower the α value and the higher Zα, with which the sample size will increase.
The precision of the estimate
As always, the precision will be reflected by the width of the confidence interval of the estimate.
Logically, we want to make an estimate as precise as possible, but it must be taken into account that the sample size increases inversely to the square of the width of the interval. This means that the smaller the interval, the larger the sample size.
Furthermore, when varying with the square of the precision, small increases in the precision of the estimation can lead to a large increase in the sample required.
The dispersion of the variable to estimate
The required sample size is directly proportional to the variance of the variable in the population. This means that the more dispersed the values of the variable (greater variance), the larger the sample size required for the same level of confidence and precision.
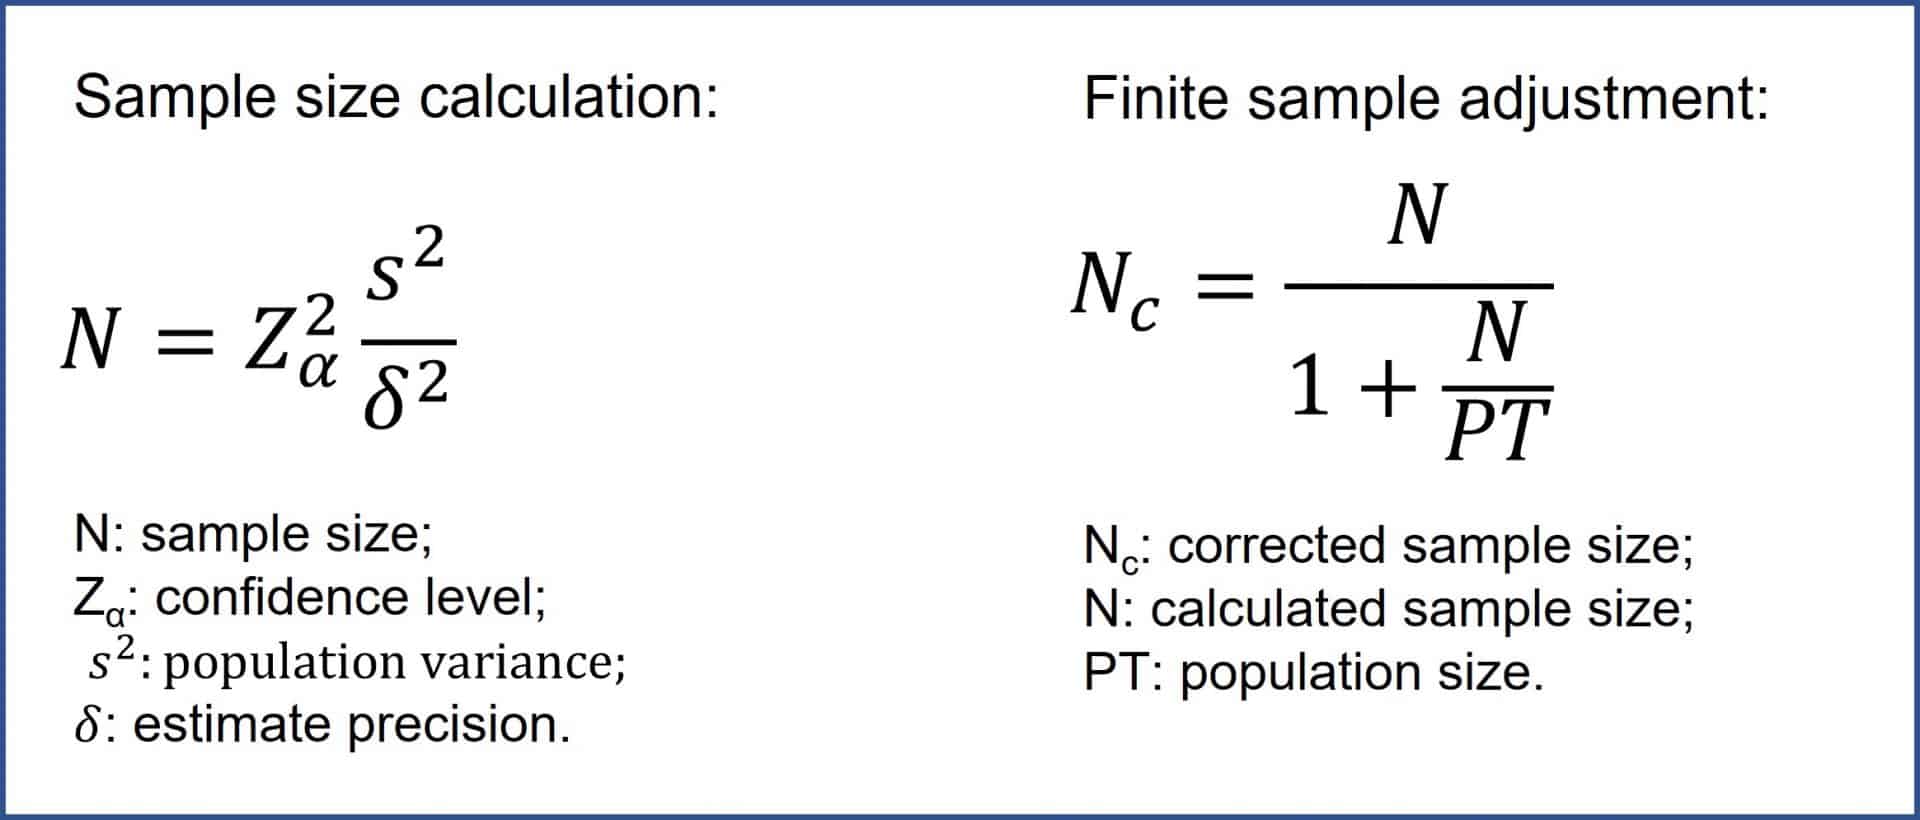
I think we can already see the formula to calculate the sample size for estimating a mean, so I show it to you in the attached figure.

A small correction
So far we have moved on the assumption of a target population large enough to be considered as infinite.
In practice, we can assume that the population is finite when it is lower than 5000. In these cases, once the sample size has been calculated according to the formula that I have already indicated, the correction indicated in the same figure will have to be made, so similar to how we did when estimating a proportion.
If we do not do this, it may even happen that the necessary sample size that we obtain is larger than the target population, so it is better to correct for a finite population and reduce the necessary sample size.
Let’s see some example
We are going with our hypercholesterolemia prevention program. We have a totally fictitious study in a population similar to ours in which the standard deviation of cholesterol is 20 mg/dl. Now we want to estimate the mean in our population, with a confidence level of 95% and a confidence interval of ± 10 mg/dl.

Well, we know that s = 20, Zα = 1.96 and d = 10.
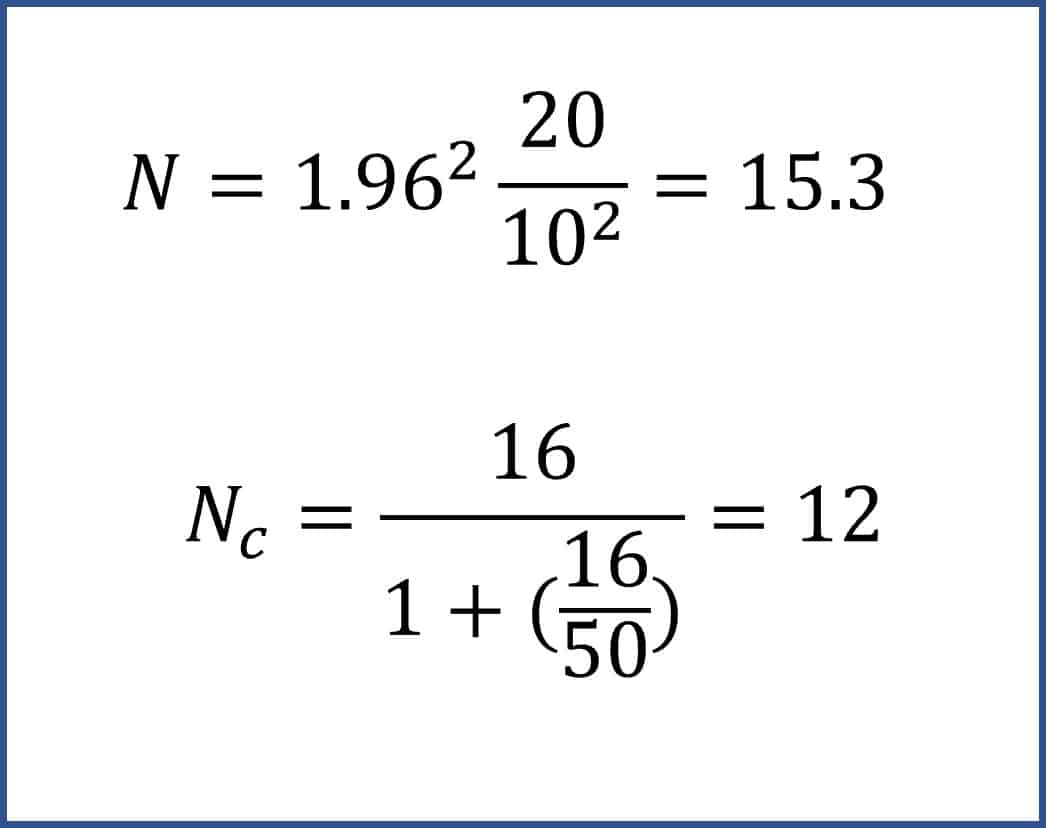
If we substitute the values in the formula, as shown in the figure, we will see that the required sample is 15.3 people, so we can round to 16.
Now we are going to suppose that we want to know the prevalence in a group of 50 people and we do not have money to test them all of. We carry out the correction for a finite sample according to the formula that we already know and obtain a slightly smaller corrected sample size, of only 12 people.
We’re leaving…
And here we leave it for today.
We have seen how to calculate the sample size necessary to estimate a population mean. In any case, although the formula is simple, I advise you to use any of the sample size calculators available on the Internet.
We have only talked about the arithmetic mean, which is the most commonly used. However, there are variations of the arithmetic mean, many of them designed to make it more robust against the presence of asymmetries or extreme values, such as the trimmed mean, the winsorized mean, and others. But that is another story…
