Trim-and-fill method.

The existence of publication bias can alter the results of a meta-analysis. The trim and fill method calculates an estimate of the effect corrected for bias that may have been introduced by missing studies. The objective is to impute these missing studies and include them in the funnel plot until the asymmetry disappears. Once this extended funnel is achieved, the effect measure is recalculated to obtain an estimate that corrects the effect of small studies.
Imagine a dark and stormy night in the mid-19th century. A group of people gather around a table, holding hands, with flickering candles casting dancing shadows on the walls. In the gloom, they eagerly await a sign from the beyond. This is the world of spiritualism, a fascinating and somewhat chilling practice that sought to communicate with the dead, revealing hidden secrets and bringing comfort (or terror) to the living. The popularity of spiritualism grew like a storm, with sessions promising answers and unexplained phenomena.
But what happens when the messages from beyond are not so clear? This is where a pinch of skepticism comes into play. Mediums and their followers often faced the difficult task of interpreting confusing and sometimes non-existent messages. This lack of clarity is reminiscent of a problem in modern science: unpublished studies in a meta-analysis. Just as spiritualists tried to fill in the gaps in their sessions, scientists conducting meta-analyses look for methods to predict and compensate for the effects of studies that never see the light of day.
Like a medium trying to hear a whisper on the wind, researchers use statistical tools to unravel the impact of those hidden studies, like the trim-and-fill method we’re going to look at today. It’s about finding patterns and signals among the noise, estimating how missing results could alter our conclusions. So, the next time you think about talking tables and spiritual sessions, remember that in the world of science, we are trying to summon our own kind of spirits: the missing data.
One funnel to rule them all
We saw in a previous post that publication bias constitutes the Achilles heel of meta-analysis, one of the most powerful tools in methodological research.
In an ideal world, all scientific studies should have the same opportunities to be published and achieve fame, but reality is not like that at all and studies can be discriminated against for various reasons such as the lack of statistical significance of their results, the low popularity of the topic they discuss, having someone to sponsor them (read: pay) and the language in which they are written.
Meta-analysis is a very powerful tool for research, but it is necessary that it collects all the relevant studies that have been carried out on the topic. The sad reality is that studies with non-significant results run a great risk of not being published unless they detect a large effect size.
The problem is obvious: if studies with negative results or with small effects are not published, the conclusions of the meta-analysis will be biased by being based only on the analysis of large studies with positive results.
Having said this, it is well understood that, in assessing the methodological quality of a meta-analysis, it is crucial to assess the possible existence of publication bias (in fact, we should assume that it exists and try to estimate its magnitude and how it can have influenced the conclusions of the meta-analysis).
There are several methods to assess the possibility of publication bias, the most popular of which is the funnel plot.
This graph represents the magnitude of the measured effect (X-axis) against a measure of precision (Y-axis), which is usually the sample size, but which can also be the inverse of the variance or of the standard error. We represent each primary study with a dot and observe the dispersion cloud.
In the most common way, with the precision measure on the Y axis, we will observe less dispersion of the results in the studies at the top of the graph, so the points will be closer together at the top of the axis and will move away, dispersing, as we approach the origin of the Y axis. It is logical, as the precision of the study decreases, the estimates oscillate more widely and the effect of the primary studies separates further from the line of average effect.
This results in a funnel-shaped point cloud, with the wide part facing down. This graph must be symmetrical and, if it is not, we must always suspect a publication bias, always under the assumption (which is nothing more than that, an assumption) that the less precise ones, which will be smaller studies, find it more difficult to be published, unless the effect they detect is large.
That gap that we will observe and that will be the cause of the funnel asymmetry is the effect that, from beyond, studies that have not seen the light of day carry out. It is time for our mediums to contact them to try to estimate what effect they might have had on our conclusions if we had been able to include them in the study.
Trim-and-fill
In the world of spiritualism, things are reduced to Ouija boards or joining hands and little else, but statisticians have devised a variety of methods to communicate with the afterlife.
Today we are going to see a graphic method closely related to the funnel plot, the trim and fill method.
This method attempts to calculate an estimate of the effect corrected for bias that may have been introduced by missing studies. The intention is to impute the missing studies and include them in the funnel plot until the asymmetry disappears. Once this extended funnel is achieved, we will recalculate the effect measure to obtain an estimate that corrects for the effect of small studies.
To achieve this, a series of steps are followed:
1. Trimming. Studies that distort the symmetry of the funnel are first located, eliminated, and the summary effect measure of the meta-analysis is recalculated. Logically, in order to do this we need the differences in study effect sizes to be due to chance alone and not to differences in study populations. In simpler terms, we do it under the assumption of the fixed-effect model, so if there is appreciable statistical heterogeneity we will have to forget about the method and think about something else.
2. Filling. Now we assume that the center of all effects is the new summary effect that we calculated in the previous step. Around this new center, we recover the studies that we cut out and we invent (we impute, actually) a new one in mirror with each of the cut out ones.
For example, if the summary measure is a standardized mean difference of 0.6 and the study we trimmed had a standardized mean difference of 0.9 (+0.3 on the right), when we redraw it we add an imputed study with a effect of 0.3 (+0.3 to the left).
Once we have represented all the studies, including those that we cut out at the beginning and their mirror equivalents, we recalculate the summary measure, applying a random effects model.
This new summary effect is the estimate corrected for the effect of missing studies. The spirits have spoken and made their small contribution, making the world of meta-analysis more egalitarian. You won’t tell me that it doesn’t have something poetic about it.
A practical example
As usual, we are going to see a practical example of how we would do this procedure, so we will surely understand it better.
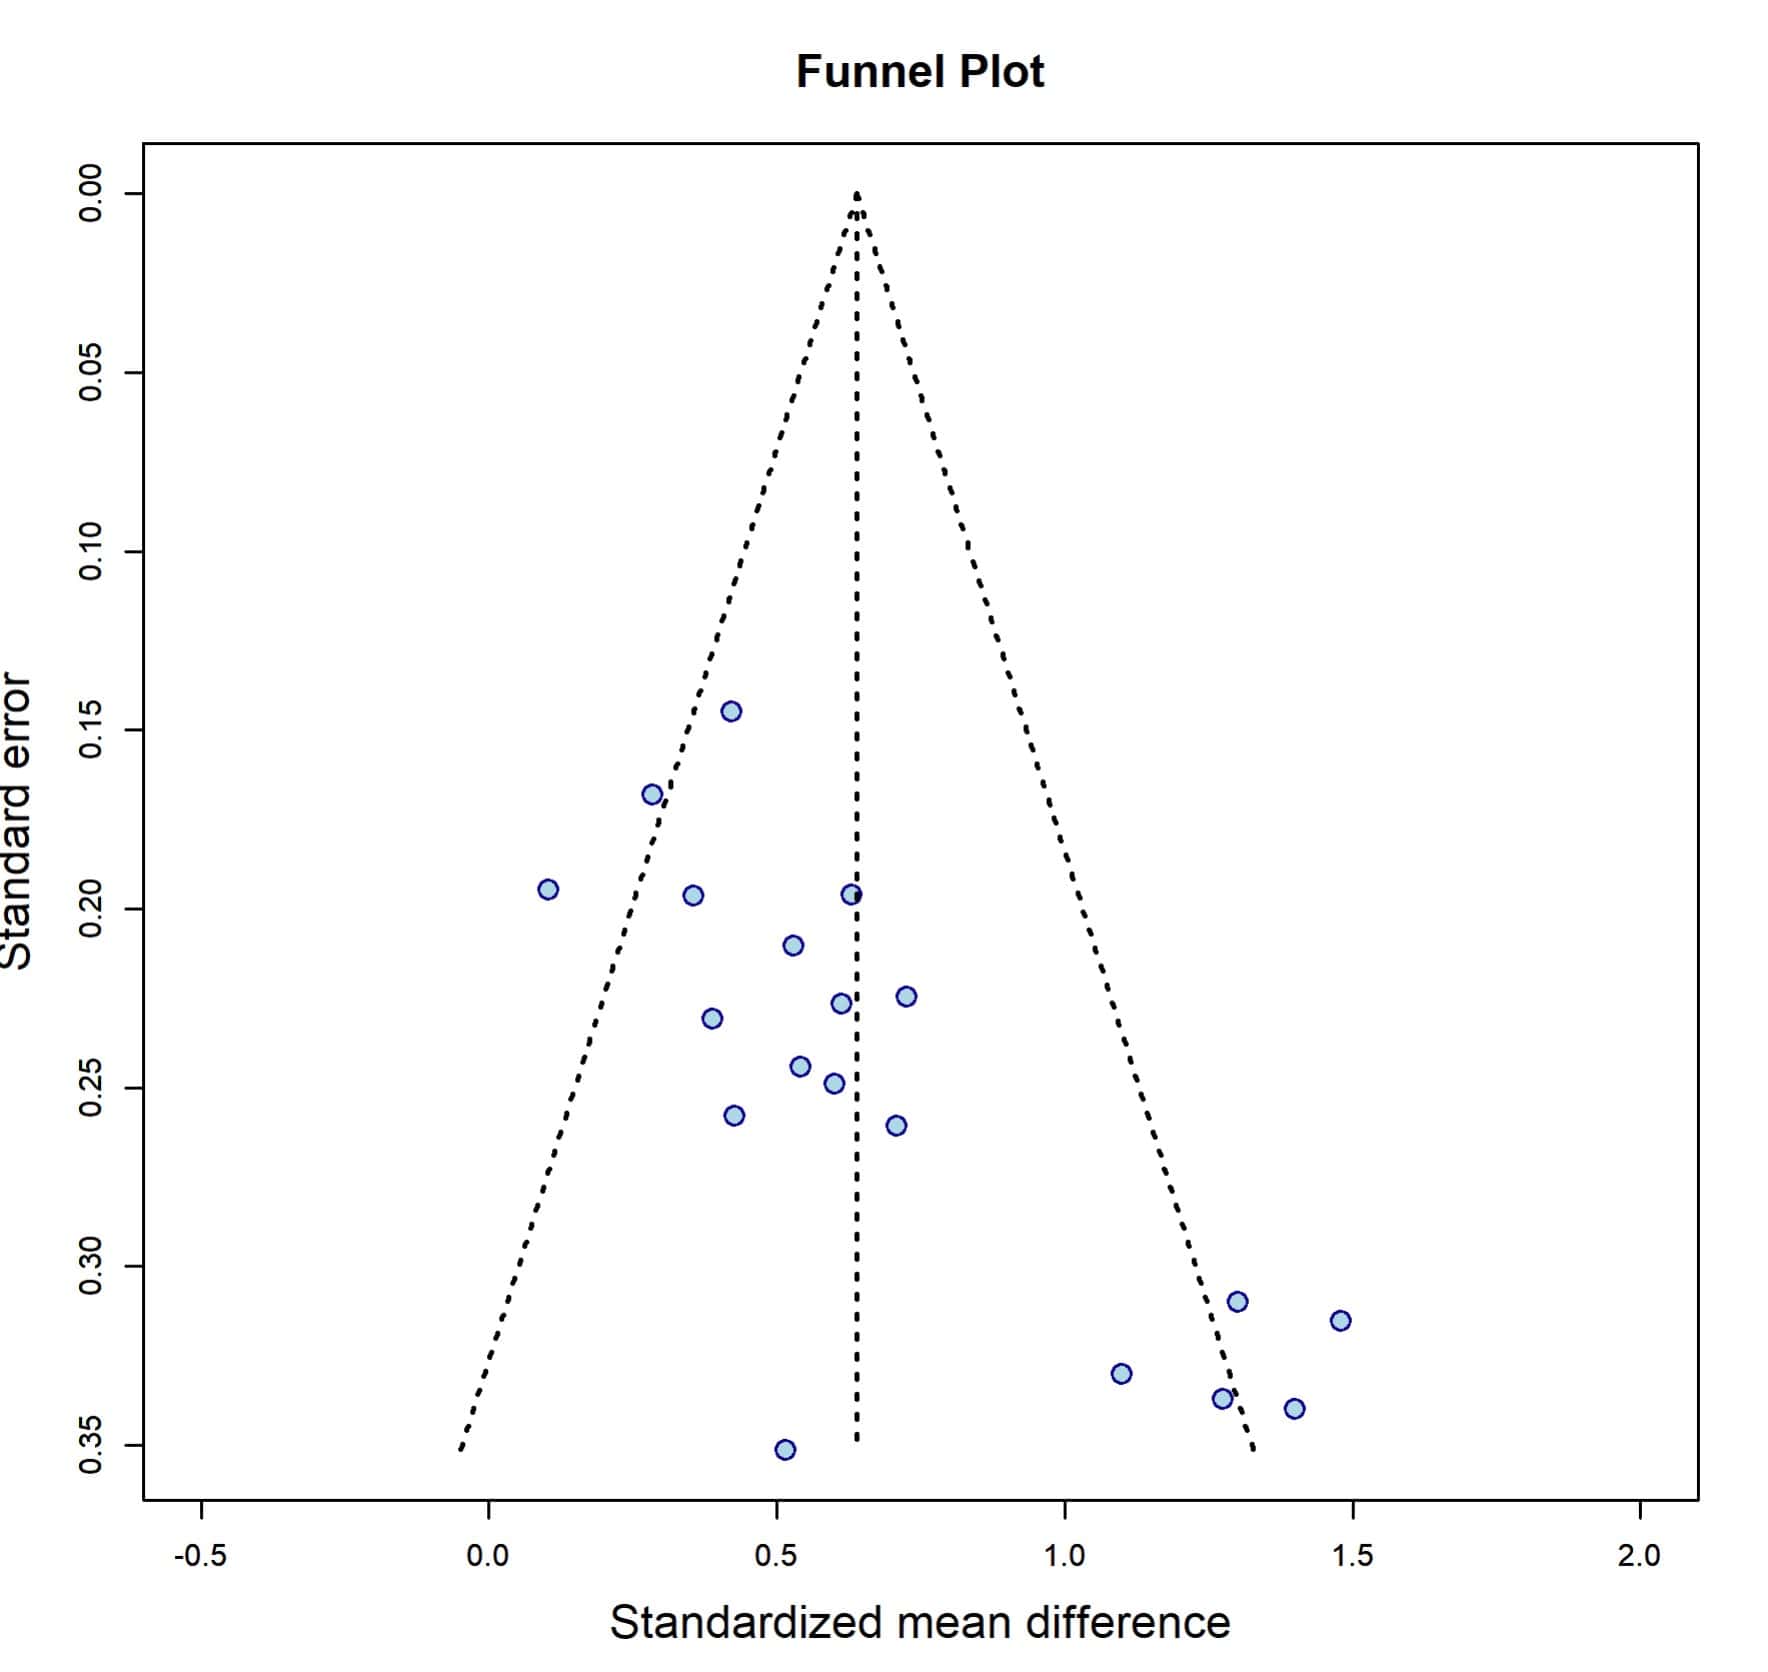
We are going to simulate a meta-analysis with dummy data from 19 studies. The measure of effect is a standardized mean difference, specifically, Hedges’ g = 0.64. Let’s first look at the funnel plot in the following figure.

The vertical line represents the estimated average effect, around which primary studies should be placed. The other dotted lines forming a triangle represent the ideal funnel within which all studies should be placed. As we already know, at the top are the most precise studies (lowest standard error), which are grouped near the line of medium effect. As we move towards the bottom of the graph, the precision decreases and the dispersion of the results increases.
The most awake of you will have already realized that the graph is not symmetrical. Although most of the studies are around the line of mean effect, there is a group of 5 studies in the lower right corner that are not represented on the contralateral side of the funnel.
Furthermore, even those close to the line of medium effect are found with preference towards the side of lower g values.
This makes us suspect that there may be a publication bias. Furthermore, our estimate may be biased, since the increase in imprecise studies, but with a large effect size, may be biasing the summary measure to the right which, in this invented case, we are going to say is the favourable side to the intervention under study.
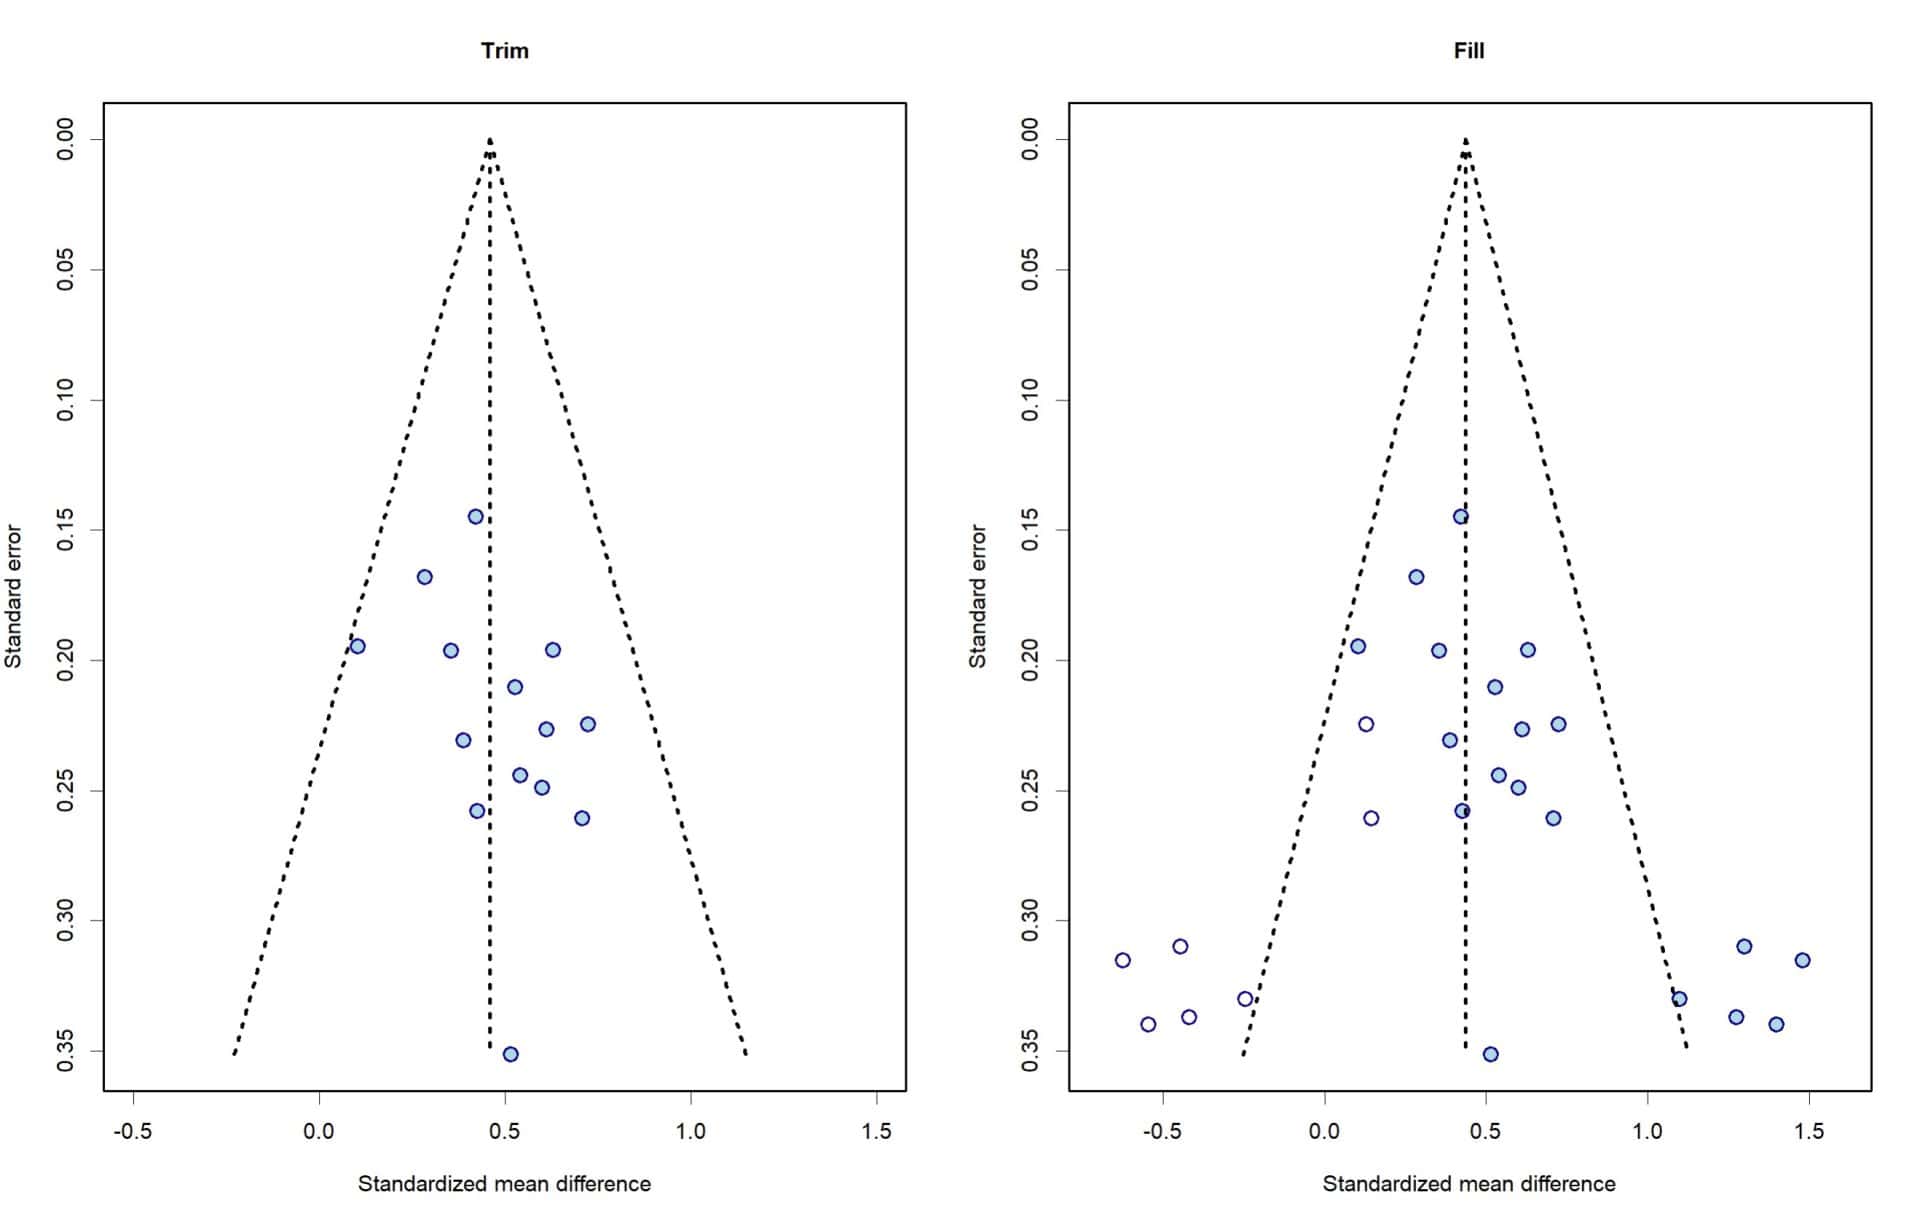
It would be good to try to estimate how the inclusion of so-called unpublished studies may change the estimate of the overall effect measure from the meta-analysis. Let’s trim and fill. You have the two graphs in the next figure.

In the first we have removed the 5 studies on the far right and we have recalculated both the effect measure and the new funnel plot. Hegdes’ g drops to 0.45, which already tells us that we were right and that the extreme values of the trimmed studies were pulling the effect measure towards the positive side.
We now dust off our Ouija board and invoke the studies of the beyond. This is done, logically, using statistical packages. I have used R and its meta and dmetar libraries.
To the right of the graph you can see the funnel plot after filling the studies that we supposedly should have found if there was no publication bias (they are the white dots). We see that the program has calculated that it had to introduce 7 studies. If you look, they are the mirror image of those who made us suspicious.
Now the funnel plot is symmetrical and, if we recalculate the effect measure again, we see that it has dropped to 0.43. There is still a significant difference, but the magnitude of the effect is smaller than it first appeared.
We are leaving…
And I think, for today, we’re going to leave the spirits alone.
We have seen how the funnel plot can help us suspect the existence of publication bias and how, by trimming and filling, we can estimate the real effect in the population when the estimate of our study may be biased.
Anyway, this method is easy to understand, but it has some limitations. We have already said that it can only be used when there is not very high heterogeneity between the primary studies in the meta-analysis.
Furthermore, publication bias is not the only cause that may be behind funnel asymmetry, since this may also be due to the presence of heterogeneity and methodological defects in the analysis or collection of data.
That is why other techniques have been developed to address this problem, such as the so-called PET-PEESE method. The PET (Precision Effect Test) is, basically, a regression of the effects estimated by the primary studies on their standard errors, while the PEESE (Precision-Effect Estimate with Standard Error) tries to correct publication bias by adjusting the estimated effect for the precision of the study. But that is another story…
