Confounding in case-control studies.

Confounding in case-control studies must be adjusted: matching is one of the techniques for doing this.
We saw in the previous post how observational studies, in particular cohort studies and case-control studies, are full of traps and loopholes. One of these traps is the backdoor through which data may be eluding us, causing that we get erroneous estimates of association measures. This backdoor is kept ajar by confounding factors.
We know that there’re several ways to control confounding. One of them, pairing, has it peculiarities in accordance whether we employ it in a cohort study or in a case-control study.
Confounding in case-control studies
When it comes to cohort studies, matching by the confounding factor allows us to obtain an adjusted measure of association. This is because we control the influence of the confounding variable on exposure and on the effect. However, the above is not fulfilled when the matching technique is used in a case-control study. The design of this type of study imposes the obligation to make the pairing once the effect has been produced.
Thus, patients that act as controls are a set of independent individuals chosen at random, since each control is selected because it fulfills a series of criteria established by the case with which it is going to be paired.
This, of course, prevents us to select other individuals in the population who do not meet the specified criteria but would be potentially included in the study. If we forget this little detail and apply the same methodology of analysis that would use a cohort study we would incur in a selection bias that would invalidate our results. In addition, although we force a similar distribution of the confounder, we only fully control its influence on the effect, but no on the exposure.
So the mentality of the analysis varies slightly when assessing the results of a case-control study in which we used the matching technique to control for confounding factors. While with an unpaired study we analyze the association between exposure and effect on the overall group, when we paired we must study the effect on the case-control pairs.
Pairing and adjusting

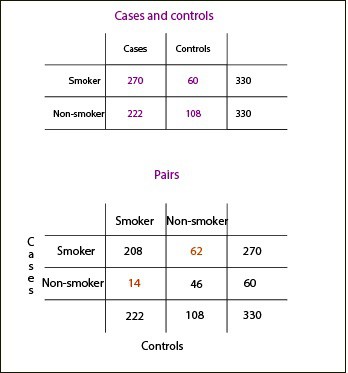
In the upper table we see the global data of the study. If we analyze the data without considering that we used the pairing to select the controls we obtain an odds ratio of 2.18, as we saw in the previous post. However, we know that this estimate is wrong. What do we do? Consider the effect of couples, but only that of those that don’t get along.
We see in the table below the distribution of the pairs according to their exposure to tobacco. We have 208 pairs in which both the case (person with laryngeal cancer) and the control are smokers. Being both subject to exposure they don’t serve to estimate their association with the effect.
The same is true of the 46 pairs in which neither the case nor the control smoke. Pairs of interest are the 14 in which the control smoke but the case don’t, and the 62 pairs in which only the case smokes, but not the control.
These discordant pairs are the ones that give us information on the effect of tobacco on the occurrence of laryngeal cancer. If we calculated the odds ratio is of 62/14 = 4.4, a measure of association stronger than the previously obtained and certainly much closer to reality.
We’re leaving…
Finally, I want to do three considerations before finishing. First, although it goes without saying, to remind you that the data are a product of my imagination and that the example is completely fictitious although it does not seem as stupid as others I invented in other posts. Second, these calculations are usually made with software por calculators, using the Mantel-Haenszel´s or the McNemar´s test.
The third is to comment that in all these examples we have used a pairing ratio of 1: 1 (one control per case), but this need not necessarily be so because, in some cases, we may be interested in using more than one control for each case. This entails its differences about the influence of the confounder on the estimated measure of association, and its considerations when performing the analysis. But that’s another story…
